This document was added or updated on 06/11/2020.
Analysis
Trend
In trend terms the total number of jobs in Australia increased by 80,500 (or 0.6%), made up of 2,500 job vacancies and 78,000 filled jobs.
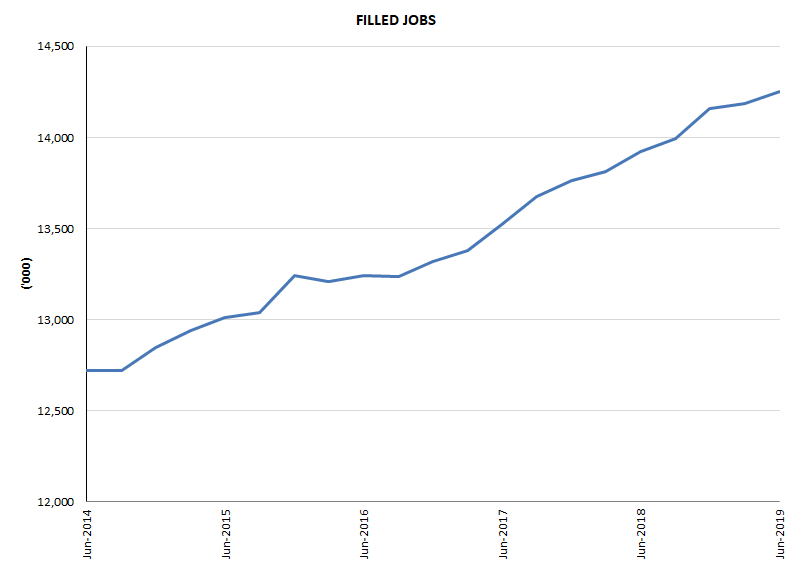
Filled jobs in Australia grew by 0.5% in the June quarter 2019, following a 0.6% rise in the March quarter 2019. Filled jobs grew 2.6% through the year in trend terms.
The number of main jobs grew by 94,000 (an increase of 0.7%) while secondary jobs decreased by 16,000 (a decrease of 1.6%) in the June quarter 2019.
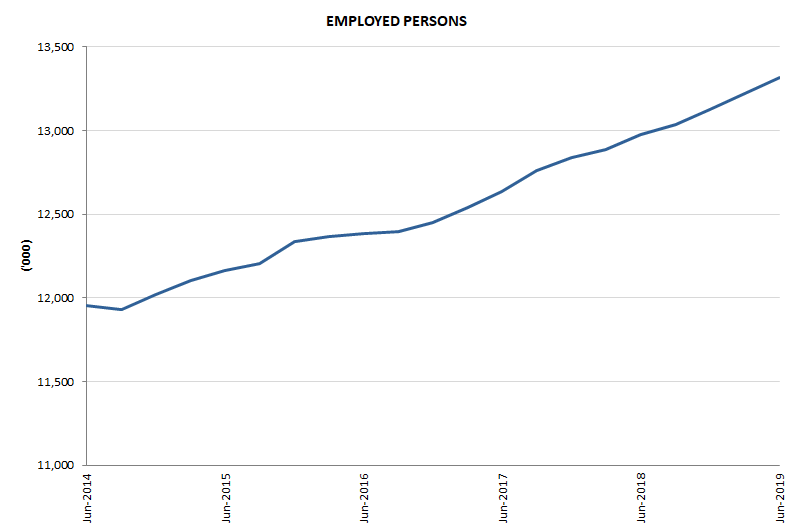
The total number of employed persons increased by 0.7% to 13.3 million in the June quarter 2019.
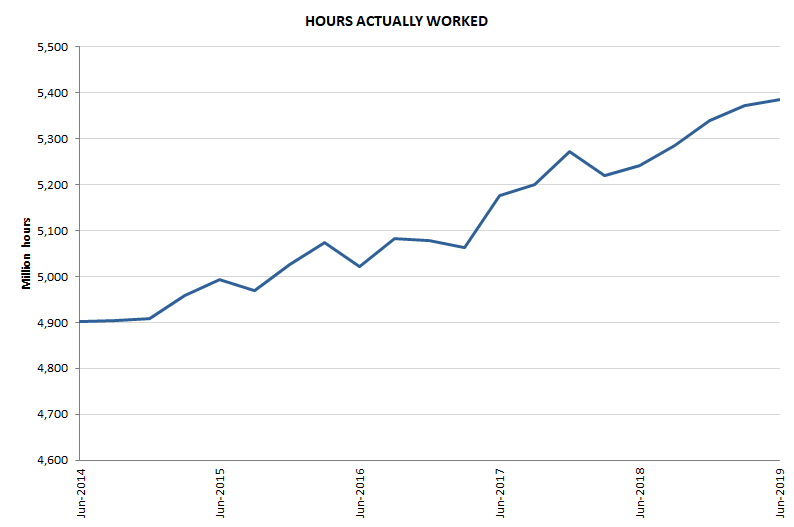
The total number of hours actually worked increased by 0.4% to 5.4 billion hours and total labour income increased by 1.2% to $254,221 million.
Seasonally adjusted
Jobs
Filled jobs in Australia grew by 0.5% in the June quarter 2019, following a 0.2% rise in the March quarter 2019. Filled jobs grew 2.4% through the year in seasonally adjusted terms.
The total number of jobs in Australia increased by 66,300 (or 0.5%), made up of a decrease of 1,000 job vacancies and an increase of 67,400 filled jobs.
The number of main jobs grew by 101,800 (an increase of 0.8%), while secondary jobs fell by 34,400 (a decrease of 3.5%) in the June quarter 2019.
Persons
The total number of employed persons increased by 0.7% to 13.3 million in the June quarter 2019.
There were 705,000 unemployed persons in the June quarter 2019, an increase of 26,000 persons from March quarter 2019.
There were 1,145,000 underemployed persons in the June quarter 2019, an increase of 74,000 persons from March quarter 2019.
Volumes
The total number of hours actually worked increased by 0.2% to 5.4 billion hours; and the total number of hours paid increased 0.8% to 5.8 billion hours.
Payments
Total labour income increased by 1.0% to $253,842 million.
Total compensation of employees increased by 1.4% to $232,043 million, and labour income from self-employment decreased by 3.3% to $21,798 million.
Over the same period, total labour costs increased by $2,503 million (0.9%) to $269,316 million.
Ratios
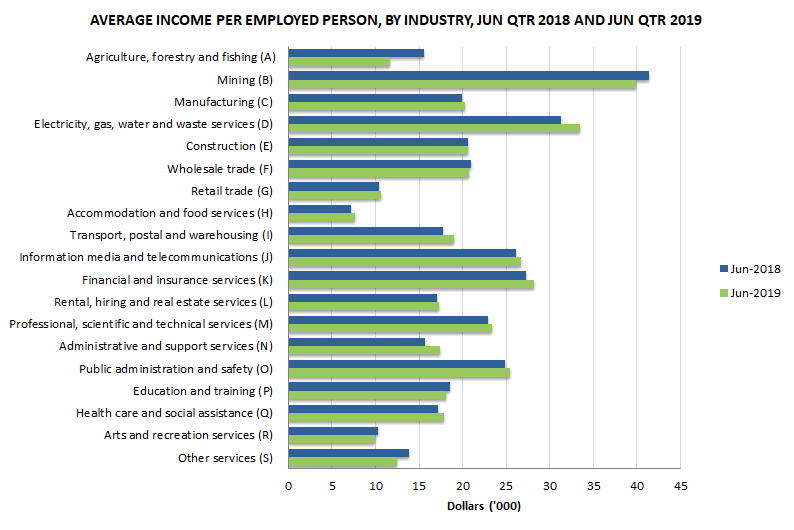
Average income per person increased by 0.3% to $19,065 in the June quarter 2019.
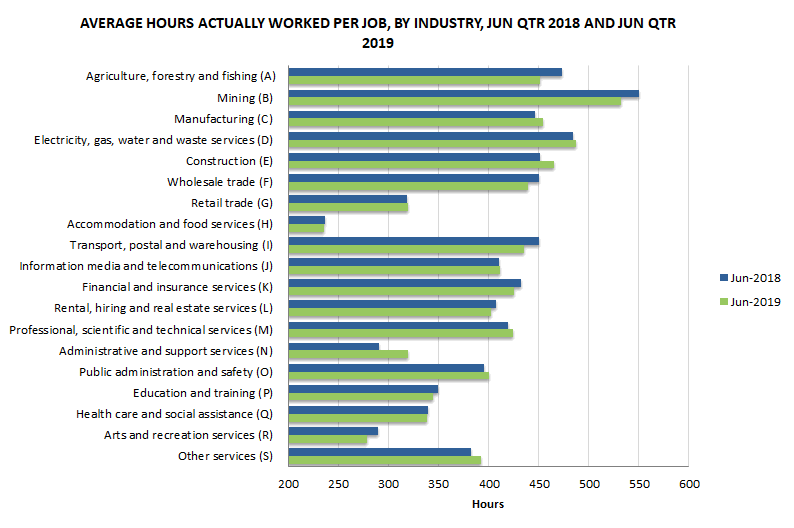
Average hours worked per job decreased by 0.2% to 378 hours. Average hours worked per job is the hours actually worked divided by all filled jobs.
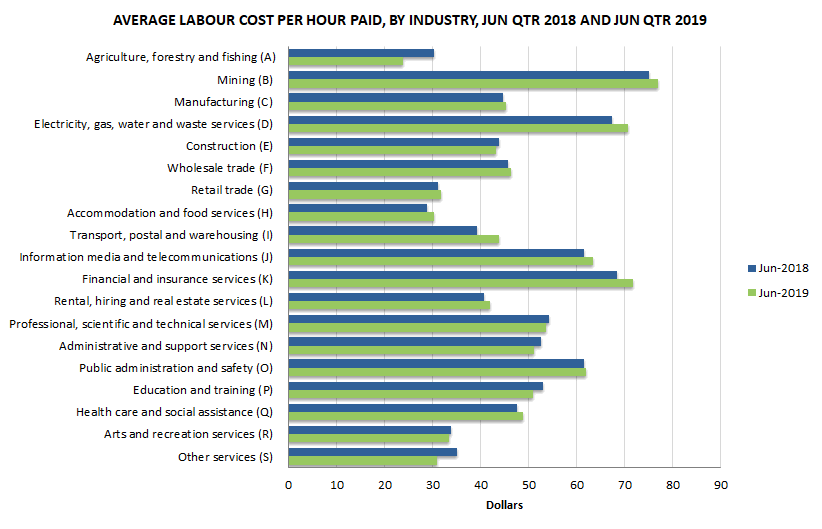
Average labour cost per hour paid remained the same at $47.
 Quality Declaration
  Print Page
 Print All