LABOUR MARKET SUMMARY
KEY MEASURES
|
 | | | | | | % change from |
| | | | | |
|
| Measure | Series type | Period | Current
figure | Previous
quarter(a) | Previous
year(b) |
|
| Employed | | | | | | |
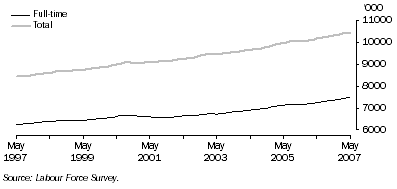
| Persons | '000 | Trend | May 2007 | 10 432.4 | 0.6 | 2.8 |
| Full-time | '000 | Trend | May 2007 | 7 498.1 | 1.0 | 3.5 |
| Part-time | '000 | Trend | May 2007 | 2 934.3 | -0.4 | 1.0 |
| Part-time employment as a proportion of total employment | % | Trend | May 2007 | 28.1 | (c)-0.3 | (c)-0.5 |
| Unemployed | | | | | | |
| Persons | '000 | Trend | May 2007 | 472.1 | -3.3 | -8.5 |
| Looking for full-time work | '000 | Trend | May 2007 | 327.3 | -4.5 | -9.5 |
| Looking for part-time work | '000 | Trend | May 2007 | 144.8 | -0.2 | -6.2 |
| Unemployment rate | | | | | | |
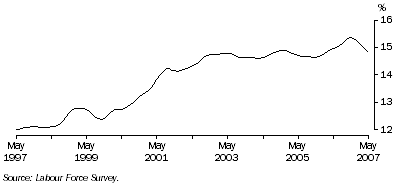
| Persons | % | Trend | May 2007 | 4.3 | (c)-0.2 | (c)-0.5 |
| Long-term unemployment | | | | | | |
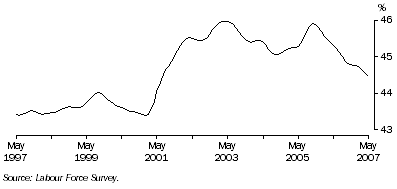
| Persons | '000 | Trend | May 2007 | 75.7 | -8.2 | -22.4 |
| As a proportion of total unemployment | % | Trend | May 2007 | 16.0 | (c)-0.9 | (c)-2.9 |
| Annual labour underutilisation rates(d) | | | | | | |
| Long-term unemployment rate | % | Original | Sep 2006 | 0.8 | na | (c)-0.1 |
| Unemployment rate | % | Original | Sep 2006 | 4.8 | na | (c)-0.4 |
| Underemployment rate | % | Original | Sep 2006 | 5.0 | na | (c)-0.3 |
| Labour force underutilisation rate | % | Original | Sep 2006 | 9.8 | na | (c)-0.7 |
| Extended labour force underutilisation rate | % | Original | Sep 2006 | 10.6 | na | (c)-0.9 |
| Children living without an employed parent(e) | % | Original | Jun 2006 | 14.4 | na | (c)-0.5 |
| Labour force participation rate | | | | | | |
| Persons aged 15-64 years | % | Original | May 2007 | 76.2 | (c)-0.2 | (c)0.5 |
| Total | % | Trend | May 2007 | 64.9 | (c)0.0 | (c)0.4 |
| Actual hours worked | | | | | | |
| Aggregate weekly hours | mill. hours | Original | May 2007 | 362.1 | 0.9 | 3.0 |
| Average weekly hours - Persons | hours | Original | May 2007 | 34.7 | -0.3 | 0.0 |
| Average weekly hours - Full-time | hours | Original | May 2007 | 41.8 | 0.4 | -0.4 |
| Average weekly hours - Part-time | hours | Original | May 2007 | 16.8 | -1.0 | -0.5 |
| Part-time workers | | | | | | |
| Proportion who preferred to work more hours | % | Original | May 2007 | 23.9 | (c)-0.9 | (c)-0.4 |
| Wage price index | | | | | | |
| Total hourly rates of pay excluding bonuses | index no. | Trend | Jun qtr 2006 | 109.7 | 1.0 | 4.1 |
| Average weekly earnings | | | | | | |
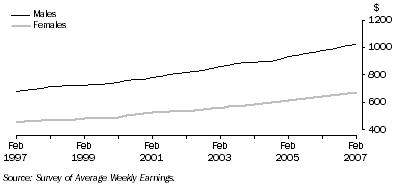
| Full-time adult ordinary time earnings | $ | Trend | Feb 2007 | 1 070.40 | 0.9 | 3.4 |
| All employees total earnings | $ | Trend | Feb 2007 | 856.10 | 1.0 | 4.4 |
| Compensation of employees | | | | | | |
| Household income account | $m | Trend | Mar qtr 2007 | 124 729 | 2.0 | 7.9 |
| Average earnings (National Accounts basis nominal) per week | $ | Trend | Mar qtr 2007 | 1 048 | 1.1 | 4.3 |
| Industrial disputes | | | | | | |
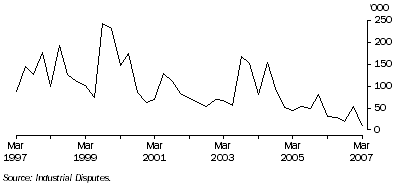
| Working days lost | '000 | Original | Mar qtr 2007 | 6.9 | -87.2 | -77.0 |
| Working days lost per 1,000 employees | number | Original | Mar qtr 2007 | 0.8 | -87.4 | -77.9 |
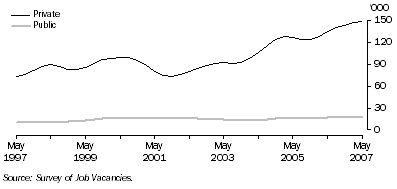
| Job vacancies | | | | | | |
| Australia | '000 | Trend | May 2007 | 166.0 | 1.7 | 9.9 |
|
| na not available |
| (a) Same period previous quarter (monthly data is presented for the middle month of each quarter). |
| (b) Same period previous year. |
| (c) Change is in percentage points. |
| (d) See table 4.1 or the Glossary for further explanation of labour underutilisation rates. |
| (e) As a proportion of all children aged under 15 years. See the Explanatory Notes for information on family data. |
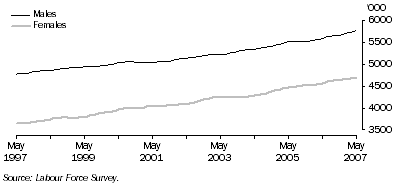
EMPLOYMENT: TREND SERIES
Full-time and total employment
 Males and females
PART-TIME EMPLOYMENT: TREND SERIES
Proportion of total employment, Males
Proportion of total employment, Females
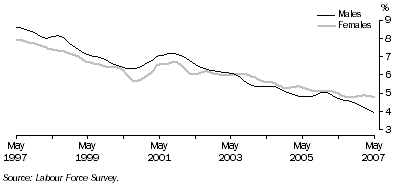
UNEMPLOYMENT RATE: TREND SERIES
Males and females
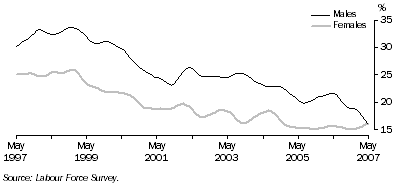
LONG-TERM UNEMPLOYMENT: TREND SERIES
Proportion of total unemployment
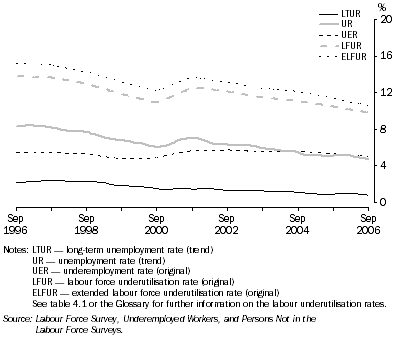
UNDERUTILISED LABOUR
Labour underutilisation rates - 1996-2006
PARTICIPATION RATE: TREND SERIES
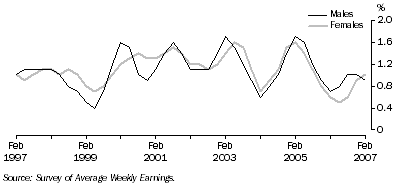
AVERAGE WEEKLY EARNINGS: TREND SERIES
Full-time adult ordinary time earnings, Quarterly change
All employees total earnings, Level
INDUSTRIAL DISPUTES: ORIGINAL SERIES
Working days lost, Quarter ending
JOB VACANCIES: TREND SERIES
Job vacancies, by Sector
 Print Page
 Print All