MARCH KEY FIGURES
 | Mar Qtr 2004 | Dec Qtr 2004 | Mar Qtr 2005 | |
| Consolidated Assets | $m | $m | $m | |
| |
| Superannuation funds | 359,784 | 412,173 | 434,688 | |
| Life insurance offices(a) | 168,267 | 184,238 | 184,274 | |
| Other managed funds | 193,278 | 216,185 | 219,721 | |
| Total | 721,330 | 812,597 | 838,683 | |
| |
| (a) Investments by superannuation funds which are held and administered by life insurance offices are included under life insurance offices. |
| See note on consolidation in Explanatory Notes, para 8 |
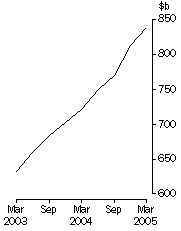
Total consolidated assets
| |
MARCH KEY POINTS
CONSOLIDATED ASSETS
- Total consolidated assets of managed funds institutions was $838.7b at 31 March 2005, an increase of $26.1b (3.2%) from the revised December quarter 2004 figure, reflecting changes in asset values during the quarter. During the March quarter 2005, the S&P/ASX 200 increased by 1.5%, the price of foreign shares (represented by the US S&P 500) decreased by 2.6% and the $A depreciated slightly against the $US by 0.9%. Domestic bond prices fell during the quarter with the 5 year Treasury Bond yield increasing by 0.3 percentage points.
- Consolidated assets of superannuation funds increased by $22.5b (5.5%) and public unit trusts by $3.2b (1.9%). Assets of life insurance offices, cash management trusts and common funds remained virtually the same. Assets of friendly societies decreased by 1.1%.
- The major asset movements for the quarter were cash and deposits, up $7.7b (12.8%), equities and units in trusts, up $7.6b (2.4%), land and buildings, up $5.8b (6.1%), and short term securities, up $4.6b (6.2%). Long term securities fell slightly by $0.6b (-0.8%).
- Investment managers had $821.4b in funds under management at 31 March 2005, up $16.5b (2.0%) from the revised March quarter 2005 figure. They managed $555.4b (66.2%) of consolidated managed funds' assets.
NOTES
CHANGES IN THIS ISSUE
There are no changes in this issue.
REVISIONS THIS ISSUE
There have been revisions in many series as a result of quality assurance work undertaken with data providers. In particular revisions back to March 2003 have been made to superannuation funds.
SIGNIFICANT EVENTS
In the March quarter 2005, the method of compiling superannuation statistics in this publication changed to incorporate detailed data collected by the Australian Prudential Regulation Authority (APRA) from large superannuation funds as part its regulatory role. APRA has not finalised data collection and quality assurance activities for the March quarter 2005, and therefore the results for superannuation funds in this publication should be considered preliminary and may be subject to revision.
In addition, data for self-managed super funds (SMSF) supplied by the ATO were revised.
ROUNDING
Discrepancies may occur between sums of the component items and totals due to rounding.
INQUIRIES
For further information about these and related statistics, contact the National Information and Referral Service on 1300 135 070 or Glen Malam on Canberra (02) 6252 5040.
ANALYSIS
CONSOLIDATED ASSETS
By type of institution
At 31 March 2005, consolidated assets of superannuation funds was $434.7b, up $22.5b (5%) since December 2004. Consolidated assets of public unit trusts, and cash management trusts experienced increases of, $3.2b (2%) and $0.3 (1%) respectively. Assets of life insurance offices, common funds and friendly societies remained virtually the same at $184.3, $9.5b and $4.5b respectively.
By type of asset
The asset movements for the quarter were in cash and deposits, up $7.7b (13%), equities and units in trusts, up $7.6b (2%), land and buildings, up $5.8b (6%), short term securities of $4.6b (6%), assets overseas, up $0.6b, other assets, up $0.2b (1%) and loans and placements, up $0.2b (1%). There was a decrease in holdings of long term securities of $0.6b (1%).
Cross investment
The table below presents the unconsolidated, cross-invested and consolidated assets of managed funds by type of fund as at 31 March 2005.
| Unconsolidated assets | Cross- invested assets | Consolidated assets | |
| Type of fund | $m | $m | $m | |
| |
| Life insurance offices | 216,022 | 31,748 | 184,274 | |
| Superannuation funds | 528,549 | 93,861 | 434,688 | |
| Public unit trusts | 197,229 | 26,177 | 171,052 | |
| Friendly societies | 6,380 | 1,909 | 4,471 | |
| Common funds | 9,896 | 365 | 9,531 | |
| Cash management trusts | 34,667 | - | 34,667 | |
| Total | 992,743 | 154,060 | 838,683 | |
| |
| - nil or rounded to zero (including null cells) |
UNCONSOLIDATED ASSETS
Life insurance offices
At 31 March 2005, the total assets of life insurance offices stood at $216.0b, a decrease of $0.3b since December 2004. Major decreases were in cash and deposits of $0.5b (6%), short term securities of $0.4b (3%) and long term securities of $0.2b (1%). There was an increase in equities and units in trusts of $1.5b (1%). Assets held overseas decreased by $0.1b (1%).
Superannuation funds
The total assets of superannuation funds held outside of life offices was $528.5b at 31 March 2005, an increase of $27.5b (5%) since December 2004. Holdings of equities and units in trusts increased by $11.4b (5%), of which units in trusts increased by $7.3b (9%) and private trading corporation shares increased by $3.3b (3%). Cash and deposits increased by $5.6b (13%), short term securities increased by $4.4b (18%), land and buildings increased by $4.2b (16%) and assets overseas increased $1.8b (2%). Long term securities decreased by $0.3b (1%).
Public unit trusts
The total assets for public unit trusts was $197.2b at 31 March 2005, up $4.5b (2%) from the revised December 2004 figure. The major increases were in land and buildings, up $1.8b (3%) and units in trusts, up $1.4b (4%).
Friendly societies
Total assets of friendly societies was $6.4 billion at 31 March 2005, virtually unchanged since December 2004. At the end of the quarter, equities and units in trusts stood at $2.4b, short term securities at $1.4b and long term securities at $1.0b. Together they accounted for 73% of total assets.
Common funds
Total assets of common funds was $9.9b at 31 March 2005, virtually unchanged since December 2004. Short term securities and loans and placements account for 46% and 20% respectively of total assets.
Cash management trusts
Total assets of cash management trusts was $34.7b at 31 March 2005, up $0.3b (1%) since December 2004. Bills of exchange increased by $2.1b (45%). Bank certificates of deposit decreased by $1.6b (10%) while cash and deposits remained virtually unchanged. Short term securities accounted for 77% of total assets.
INVESTMENT MANAGERS
Source of funds under management
During March quarter 2005 there was an increase in total funds under management by investment managers of $16.5b (2%), bringing the total funds under management to $821.4b.
The value of funds under management on behalf of superannuation funds increased by $5.8b (2%), life insurance offices increased by $3.6b (3%) and public unit trusts increased by $3.1b (3%).
During the quarter the value of funds under management on behalf of sources other than managed funds increased $1.9b (1%). Of this, the largest increase was funds under management on behalf of trusts other than public unit trusts, $1.7b (2%). There were increases also in the value of funds under management on behalf of general insurance, $0.6b (2%) and Government, $0.3b (2%). While funds under management on behalf of other investment managers decreased by $0.7b (1%).
The value of funds under management on behalf of overseas sources decreased to $28.9b down $0.3 (1%) from the previous quarter.
Continuing merger activity has resulted in changed reporting arrangements for some fund managers. The ABS continues to work with the relevant fund managers to clarify these changes in reporting and assess their impact on the estimates.
The value of managed funds assets invested through investment managers was $555.4b at 31 March 2005, representing 66.2% of the consolidated assets of managed funds.
 Print Page
 Print All