What If...? Revisions to trend estimates
Effect of new seasonally adjusted estimates on trend estimates
Trend revisions
Recent seasonally adjusted and trend estimates are likely to be revised when original estimates for subsequent quarters become available. The approximate effects of possible scenarios on trend estimates for capital expenditure in chain volume terms are presented below by illustrating the impact if next quarter's seasonally adjusted estimate rises or falls by a specified percentage (based on the historical average of movements in seasonally adjusted estimates). For further information, see paragraphs 41 and 42 in the Explanatory Notes.
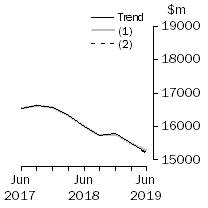
Buildings and Structures
 |
 | | | | WHAT IF NEXT QUARTER'S
SEASONALLY ADJUSTED ESTIMATE: |
| | Trend as published | (1) rises by 2.1%
on this quarter | (2) falls by 2.1%
on this quarter |
| | $m | % | $m | % | $m | % |
|
| 2018 | | | | | | |
| September | 15 728 | -1.8 | 15 728 | -1.8 | 15 728 | -1.8 |
| December | 15 791 | 0.4 | 15 771 | 0.3 | 15 792 | 0.4 |
| 2019 | | | | | | |
| March | 15 498 | -1.9 | 15 502 | -1.7 | 15 494 | -1.9 |
| June | 15 221 | -1.8 | 15 281 | -1.4 | 15 176 | -2.0 |
|
|
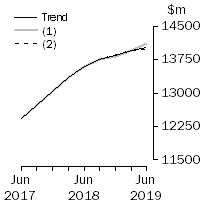
Equipment, Plant and Machinery
 |
| | | | WHAT IF NEXT QUARTER'S
SEASONALLY ADJUSTED ESTIMATE: |
| | Trend as published | (1) rises by 1.9%
on this quarter | (2) falls by 1.9%
on this quarter |
| | $m | % | $m | % | $m | % |
|
| 2018 | | | | | | |
| September | 13 750 | 1.1 | 13 750 | 1.1 | 13 750 | 1.1 |
| December | 13 849 | 0.7 | 13 839 | 0.6 | 13 864 | 0.8 |
| 2019 | | | | | | |
| March | 13 954 | 0.8 | 13 957 | 0.9 | 13 948 | 0.6 |
| June | 14 038 | 0.6 | 14 112 | 1.1 | 13 992 | 0.3 |
|
|
Total Capital Expenditure
 |
| | | | WHAT IF NEXT QUARTER'S
SEASONALLY ADJUSTED ESTIMATE: |
| | Trend as published | (1) rises by 2.0%
on this quarter | (2) falls by 2.0%
on this quarter |
| | $m | % | $m | % | $m | % |
|
| 2018 | | | | | | |
| September | 29 478 | -0.5 | 29 478 | -0.5 | 29 478 | -0.5 |
| December | 29 643 | 0.6 | 29 611 | 0.5 | 29 657 | 0.6 |
| 2019 | | | | | | |
| March | 29 453 | -0.6 | 29 463 | -0.5 | 29 447 | -0.7 |
| June | 29 240 | -0.7 | 29 392 | -0.2 | 29 172 | -0.9 |
|
|
 Quality Declaration
  Print Page
 Print All