The GFS framework reflects taxation revenue collected by each level of government. The purpose of this appendix is to consider an alternative presentation of revenue which takes into account the level of government at which revenue is used rather than simply collected. The analysis considers the flows, by way of current grants, that occur between the levels of government in Australia, and the impact that this has on revenue at each of these levels. Also considered is the effect of direct and indirect transfers to households on total revenue. To aid in the understanding of these flows, the following analytical measures of revenue have been derived. Users should note that these measures are not themselves part of the GFS framework.
ADJUSTED TAXATION REVENUE
Adjusted taxation revenue is equal to GFS taxation revenue collected by each level of government, plus current grants received from higher levels of government, less current grants paid to lower levels of government. This measure is designed to give a clearer indication of the levels of government at which taxation revenue is actually used or spent. The source for a significant amount of the current grants distributed between levels of government is taxation revenue, such as the GST. However, some of the revenue distributed may have come from a source other than taxation. Further, it should be noted that some of the current grants transferred from Commonwealth Government to the state and local governments are Specific Purpose Payments (SPPs). Unlike the GST-related grants, these payments are 'tied' to specific policy areas as agreed between the two levels of government. Similar arrangements exist between state and local government. SPPs for current purposes are included with other current grants in deriving adjusted taxation revenue.
ADJUSTED TOTAL REVENUE
Adjusted total revenue is equal to adjusted taxation revenue plus all other non-taxation sources of revenue. Non-taxation revenue includes revenue from sales of goods and services, property income (interest, dividends, income tax equivalents, land rents and royalties), fines, capital transfers, and current transfers other than grants. Current grants are excluded from non-taxation revenue because these have already been taken into account in deriving adjusted taxation revenue.
ADJUSTED TOTAL REVENUE LESS TRANSFERS TO HOUSEHOLDS
An important role of government is the redistribution of income, by way of direct and indirect 'benefits', to individual households. These transfers can be deducted from adjusted total revenue to derive adjusted total revenue less transfers to households. Direct benefits are regular cash payments made to households by government without any requirement to provide goods and services in return (e.g. welfare payments). Indirect benefits are non-cash benefits and services provided by government to individual households (e.g. concessions for transport and utilities, medical and pharmaceutical benefits and natural disaster relief).
The three derived measures explained above are illustrated in the following diagram:
ADJUSTED TAXATION REVENUE
Table 1 shows the derivation of adjusted taxation revenue, for all three levels of government and the multi-jurisdictional general government sector in Australia.
TABLE 1. ADJUSTED TAXATION REVENUE, By Level of Government, and as % of GDP(a)
2009-10
2010-11
2011-12
2012-13
2013-14
2014-15
$m
$m
$m
$m
$m
$m
COMMONWEALTH
1. Taxation revenue collected(b)
268 570
290 047
318 570
339 450
353 116
357 406
As % of GDP
20.7
20.6
21.4
22.3
22.3
22.2
As % of total tax revenue
80.3
80.5
81.5
81.5
81.0
80.1
2. Current grants to state government(c)
75 682
79 978
84 064
84 870
88 625
96 418
3. Current grants to local government
12
14
35
32
66
0
4. Current grants to multi-jurisdictional sector(d)
8 808
8 250
8 617
9 108
9 634
9 985
5. Adjusted taxation revenue =1-2-3-4(e)
184 068
201 805
225 855
245 440
254 791
251 003
As % of GDP
14.2
14.3
15.1
16.1
16.1
15.6
As % of total tax revenue
55.1
56.0
57.8
59.0
58.5
56.3
STATE
1. Taxation revenue collected(b)
54 764
58 395
59 950
63 577
68 720
73 640
As % of GDP
4.2
4.1
4.0
4.2
4.3
4.6
As % of total tax revenue
16.4
16.2
15.3
15.3
15.8
16.5
2. Current grants from Commonwealth government
75 682
79 978
84 064
84 870
88 625
96 418
3. Current grants to local government
2 857
3 333
4 217
3 737
2 719
4 310
4. Current grants to multi-jurisdictional sector(d)
499
569
501
538
464
408
5. Adjusted taxation revenue =1+2-3-4(e)
127 090
134 471
139 296
144 172
154 162
165 340
As % of GDP
9.8
9.5
9.3
9.5
9.7
10.3
As % of total tax revenue
38.0
37.3
35.6
34.6
35.4
37.1
LOCAL
1. Taxation revenue collected(b)
11 607
12 449
13 202
14 027
14 870
15 779
As % of GDP
0.9
0.9
0.9
0.9
0.9
1.0
As % of total tax revenue
3.5
3.5
3.4
3.4
3.4
3.5
2. Current grants from Commonwealth government
12
14
35
32
66
0
3. Current grants from state government
2 857
3 333
4 217
3 737
2 719
4 310
4. Adjusted taxation revenue = 1+2+3(e)
14 476
15 797
17 454
17 797
17 655
20 090
As % of GDP
1.1
1.1
1.2
1.2
1.1
1.2
As % of total tax revenue
4.3
4.4
4.5
4.3
4.1
4.5
MULTI-JURISDICTIONAL
1. Taxation revenue collected(b)
-
-
-
-
-
-
2. Current grants from Commonwealth government
8 808
8 250
8 617
9 108
9 634
9 985
3. Current grants from state government
499
569
501
538
464
408
4. Adjusted taxation revenue = 1+2+3(e)
9 306
8 819
9 118
9 647
10 098
10 393
As % of GDP
0.7
0.6
0.6
0.6
0.6
0.6
As % of total tax revenue
2.8
2.4
2.3
2.3
2.3
2.3
TOTAL
Gross Domestic Product
1 296 797
1 409 795
1 491 046
1 524 383
1 584 578
1 609 513
Total taxation revenue collected
334 282
360 210
390 999
416 283
435 892
445 965
As % of GDP
25.8
25.6
26.2
27.3
27.5
27.7
- nil or rounded to zero (including null cells)
(a) Based on GDP at current prices as published in Australian National Accounts: National Income, Expenditure and Product, December Quarter 2015 (Cat. no. 5206.0), Table 36 Expenditure on Gross Domestic Product (GDP), Chain Volume Measures and Current Prices: Annual.
(b) According to GFSM2001.
(c) Part of the Commonwealth Government grants paid to State Governments are passed on to Local Governments.
(d) The multi-jurisdictional sector contains units where jurisdiction is shared between two or more governments, or where classification of a unit to a jurisdiction is otherwise unclear. The main type of units currently falling into this category are the public universities.
(e) The sum of taxation revenue for all levels of government does not equal the sum of adjusted taxation revenue for all levels of government as a result of consolidation.
ADJUSTED TOTAL REVENUE, AND ADJUSTED TOTAL REVENUE LESS TRANSFERS TO HOUSEHOLDS
Table 2 below shows adjusted total revenue, and adjusted total revenue less transfers to households for all three levels of government.
TABLE 2. ADJUSTED TOTAL REVENUE, Less Transfers to Households, and as % of GDP(a)
2009-10
2010-11
2011-12
2012-13
2013-14
2014-15
$m
$m
$m
$m
$m
$m
COMMONWEALTH
1. Adjusted taxation revenue(b)
184 068
201 805
225 855
245 440
254 791
251 003
2. Non-taxation revenue(c)
24 078
19 935
20 010
22 805
20 862
24 041
3. Adjusted total revenue =1+2
208 146
221 740
245 865
268 244
275 653
275 044
As % of GDP
16.1
15.7
16.5
17.6
17.4
17.1
4. Direct benefits to households(d)
98 490
105 559
112 907
117 221
125 174
129 190
5. Indirect benefits to households(e)
33 548
36 315
39 400
39 283
40 943
44 028
6. Adjusted total revenue, less transfers to households =3-4-5
76 108
79 865
93 557
111 740
109 537
101 826
As % of GDP
5.9
5.7
6.3
7.3
6.9
6.3
STATE
1. Adjusted taxation revenue(b)
127 090
134 471
139 296
144 172
154 162
165 340
2. Non-taxation revenue, excluding current grants from Commonwealth government(c)
64 113
62 010
65 987
59 141
67 689
65 979
3. Adjusted total revenue =1+2
191 203
196 481
205 283
203 313
221 851
231 319
As % of GDP
14.7
13.9
13.8
13.3
14.0
14.4
4. Direct benefits to households(d)
1 948
1 583
1 339
1 412
1 483
1 006
5. Indirect benefits to households(e)
3 681
4 088
4 459
4 749
5 341
5 340
6. Adjusted total revenue, less transfers to households = 3-4-5
185 574
190 810
199 485
197 153
215 028
224 973
As % of GDP
14.3
13.5
13.4
12.9
13.6
14.0
LOCAL
1. Adjusted taxation revenue(b)
14 476
15 797
17 454
17 797
17 655
20 090
2. Non-taxation revenue, excluding current grants from Commonwealth and state governments(c)
18 211
18 710
19 458
20 784
21 207
21 246
3. Adjusted total revenue =1+2
32 688
34 507
36 912
38 581
38 862
41 336
As % of GDP
2.5
2.4
2.5
2.5
2.5
2.6
4. Direct and indirect benefits to households(f)
. .
. .
. .
. .
. .
. .
5. Adjusted total revenue, less transfers to households = 3-4
32 688
34 507
36 912
38 581
38 862
41 336
As % of GDP
2.5
2.4
2.5
2.5
2.5
2.6
. . not applicable
(a) Based on GDP at current prices as published in Australian National Accounts: National Income, Expenditure and Product, December Quarter 2015 (Cat. no. 5206.0), Table 36 Expenditure on Gross Domestic Product (GDP), Chain Volume Measures and Current Prices: Annual.
(b) Derived in Table 1.
(c) Non-taxation revenue includes revenue from sales of goods and services, interest income, other property income (such as dividends, income tax equivalents, land rents and royalties), fines, capital revenue, and all current revenue other than grants.
(d) Direct benefits to households are monetary transfers.
(e) Indirect benefits to households are transfers 'in-kind' via goods and services.
(f) Local government does not make transfers of this kind to households.
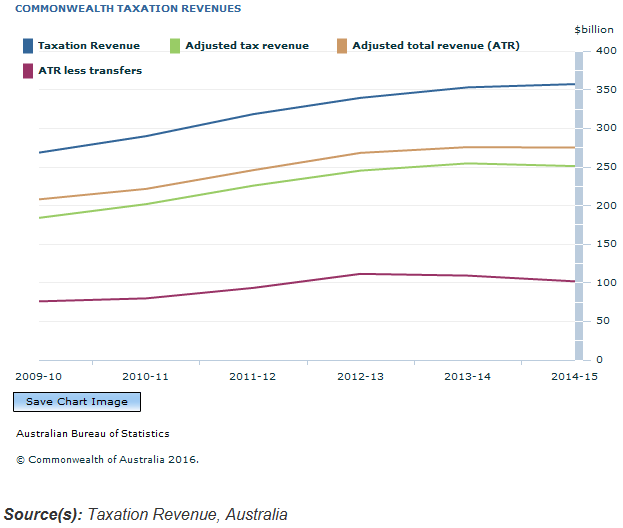
Commonwealth taxation revenues
Commonwealth Government taxation revenue increased for one measure and decreased for all others from 2013-14 to 2014-15:
Commonwealth taxation revenue was $357,406m, an increase of $4,290m (1.2%).
Commonwealth adjusted taxation revenue was $251,003m, a decrease of $3,788m (-1.5%).
Commonwealth adjusted total revenue was $275,044m, a decrease of $609m (-0.2%).
Commonwealth adjusted total revenue less transfers to households was $101,826m, a decrease of $7,711m (-7.0%).
Commonwealth adjusted total revenue less transfers to households as a proportion of GDP, decreased from 6.9% to 6.3%.
Source(s): Taxation Revenue, Australia
State government taxation revenues
State government taxation revenue increased for all measures from 2013-14 to 2014-15:
State taxation revenue was $73,640m, an increase of $4,920m (7.2%).
State adjusted taxation revenue was $165,340m, an increase of $11,178m (7.3%).
State adjusted total revenue was $231,319m, an increase of $9,468m (4.3%).
State adjusted total revenue less transfers to households was $224,973m, an increase of $9,945m (4.6%).
State adjusted total revenue less transfers to households as a proportion of GDP, increased from 13.6% to 14.0%.
Source(s): Taxation Revenue, Australia
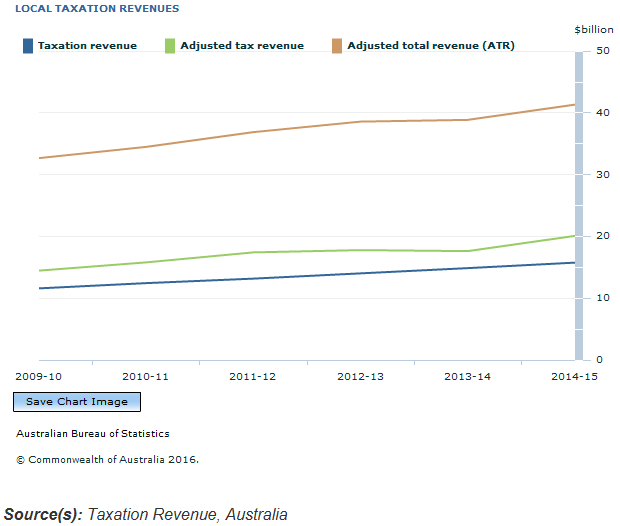
Local taxation revenue
All measures of Local taxation revenue increased from 2013-14 to 2014-15:
Local taxation revenue was $15,779m, an increase of $909m (6.1%).
Local adjusted taxation revenue was $20,090m, an increase of $2,435m (13.8%).
Local total revenue less transfers to households was $41,336m, an increase of $2,474m (6.4%).
Local adjusted total revenue less transfers to households as a proportion of GDP, increased from 2.5% to 2.6%.
Source(s): Taxation Revenue, Australia
Document Selection
These documents will be presented in a new window.
 Quality Declaration
  Print Page
 Print All