EFFECT OF NEW SEASONALLY ADJUSTED ESTIMATES ON TREND ESTIMATES
Readers should exercise care in the interpretation of the trend data as the last three observations, in particular, are likely to be revised with the addition of subsequent months’ data. For further information, see Explanatory Note 7.
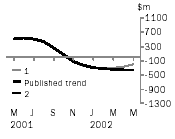
TREND REVISIONS
The graph below presents the effect of two possible scenarios on the previous trend estimates:
1 The May seasonally adjusted estimate of the balance on goods and services ‘improves’ by $200m when compared with the April seasonally adjusted estimate. (An ‘improvement’ refers to an increase in a surplus or a decrease in a deficit.)
2 The May seasonally adjusted estimate of the balance on goods and services ‘deteriorates’ by $200m when compared with the April seasonally adjusted estimate. (A ‘deterioration’ refers to a decrease in a surplus or an increase in a deficit.)
The change of $200m has been chosen because in the last decade the average monthly movement, without regard to sign, of the seasonally adjusted balance on goods and services series has been approximately $200m.
|
BALANCE ON GOODS
AND SERVICES
 |  | TREND AS
PUBLISHED | WHAT IF NEXT MONTH’S SEASONALLY
ADJUSTED ESTIMATE: |
|
|
|
| | 1 | 2 |
| | improves by
$200m on
Apr 2002 | deteriorates by
$200m on
Apr 2002 |
| $m | $m | $m |
|
|
| October 2001 | 69 | 69 | 69 |
| November 2001 | - 113 | - 121 | - 114 |
| December 2001 | - 230 | - 246 | - 232 |
| January 2002 | - 292 | - 300 | - 293 |
| February 2002 | - 326 | - 313 | - 331 |
| March 2002 | - 345 | - 296 | - 355 |
| April 2002 | - 335 | - 263 | - 374 |
| May 2002 | | - 208 | - 376 |
|
 Print Page
 Print All