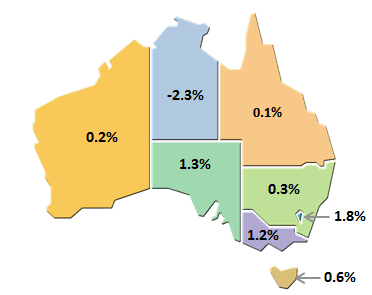
MAIN FEATURES STATE FINAL DEMAND CHAIN VOLUME MEASURES
 |  | Seasonally adjusted, % change from Mar 18 to Jun 18 |
 |  | NSW | Vic. | Qld | SA | WA | Tas. | NT | ACT | Aust.(a) |
 |  |  |  |  |  |  |  |  |  |  |
|
| Final consumption expenditure |  |  |  |  |  |  |  |  |  |
 | General government | -0.1 | 2.4 | - | -0.9 | 1.7 | 1.5 | 2.0 | 4.6 | 1.0 |
 | Households | 0.8 | 0.9 | 0.3 | 0.4 | 0.1 | 1.5 | 0.6 | 1.1 | 0.7 |
| Gross fixed capital formation |  |  |  |  |  |  |  |  |  |
 | Private | -0.5 | - | 0.5 | 9.4 | -1.3 | -0.3 | -12.7 | -0.7 | - |
 | Public | -0.8 | 5.9 | -3.1 | -8.1 | 2.9 | -9.1 | 8.1 | -6.3 | - |
| State final demand | 0.3 | 1.2 | 0.1 | 1.3 | 0.2 | 0.6 | -2.3 | 1.8 | 0.6 |
|
| - nil or rounded to zero (including null cells) |
| (a) Australia estimates relate to Domestic final demand. |
JUNE QUARTER
Summary Comments
Australia
- Australian domestic final demand increased 0.6% in the June quarter 2018. State final demand increased across all states and territories with the exception of the Northern Territory.
STATE FINAL DEMAND, Quarterly Volumeámeasures
: Seasonally adjusted

New South Wales
- New South Wales' state final demand increased 0.3% in the June quarter and follows a 1.0% increase in the March quarter. Household final consumption expenditure drove growth in state final demand. Public capital investment and expenditure detracted slightly from growth. Private capital investment also decreased in NSW, with growth in dwelling investment offset by falls in non-dwelling construction and expenditure on machinery and equipment.
Victoria
- Victoria's state final demand increased 1.2% in the June quarter and follows a 2.5% increase in the March quarter. Household final consumption expenditure was the strongest contributor to growth. Government final consumption expenditure also contributed solidly to growth, as did public capital investment. Both components of public sector growth were driven by state and local expenditure. Private capital investment growth was flat for the quarter with a solid contribution from dwelling investment being offset by falls in non-dwelling construction and expenditure on machinery and equipment.
Queensland
- Queensland's state final demand increased 0.1% in the June quarter and follows a 1.0% increase in the March quarter. Household final consumption expenditure drove the growth in state final demand. Private capital investment also contributed to growth driven by expenditure on machinery and equipment and dwelling investment but partially offset by a decrease in non-dwelling construction. Public capital investment decreased in Queensland while government final consumption expenditure was flat.
South Australia
- South Australia's state final demand increased 1.3% in the June quarter following a revised increase of 0.4% in the March quarter. The rise was primarily driven by strength in private capital investment thanks to a strong increase in non-dwelling construction. Household final consumption expenditure also contributed to the rise. Public capital investment and government final consumption expenditure both decreased, partially offsetting the rise coming from the private sector.
Western Australia
- Western Australia's state final demand increased 0.2% in the June quarter following a 1.2% decrease in the March quarter. The rise in the June quarter was driven by government expenditure and public capital investment. Household final consumption expenditure also contributed to growth for the quarter. Private capital investment detracted from growth, with falls in non-dwelling construction, and machinery and equipment.
Tasmania
- Tasmania's state final demand increased 0.6% in the June quarter and follows a 2.0% increase in the March quarter. Household final consumption expenditure drove the growth and government final consumption expenditure also increased. Public gross fixed capital partially offset growth. The fall in public capital investment was spread across all levels of government and sub-sectors. Private capital investment also detracted from growth in the quarter due to reduced investment in machinery and equipment.
Northern Territory
- Northern Territory's state final demand decreased 2.3% in the June quarter and follows a 1.7% decrease in the March quarter. The largest detractor from growth was private capital investment driven by non-dwelling construction. Both government and household final consumption expenditure increased as did public capital investment. Public sector growth was driven by state and local governments.
Australian Capital Territory
- Australian Capital Territory's state final demand increased 1.8% in the June quarter following a 0.2% decrease in the March quarter. Government final consumption expenditure drove the growth in the June quarter, predominantly due to national consumption expenditure. Household final consumption expenditure also contributed to the rise. Falls in public capital investment was driven by public non-financial corporations. Private capital investment was driven by reduced expenditure on machinery and equipment which was partially offset by a rise in non-dwelling construction.
 Quality Declaration
  Print Page
 Print All