MAIN FEATURES INCOME AT CURRENT PRICES
 | | Trend | Seasonally adjusted |
| | % change
Dec 15
to Mar 16 | % change Mar 15 to Mar 16 | % points contributions to growth in GDP Dec 15 to Mar 16 | % change
Dec 15
to Mar 16 | % change Mar 15 to Mar 16 | % points contributions to growth in GDP Dec 15 to Mar 16 |
|
| Compensation of employees | 0.7 | 3.3 | 0.4 | 0.8 | 3.6 | 0.4 |
| Gross operating surplus | | | | | | |
| Private non-financial corporations | -0.8 | -3.0 | -0.1 | -2.9 | -5.3 | -0.5 |
| Other(a) | 0.9 | 3.7 | 0.2 | 1.0 | 4.2 | 0.2 |
| Gross mixed income | 0.3 | 5.3 | - | 1.5 | 5.2 | 0.1 |
| Taxes less subsidies on production and imports | 0.9 | 5.4 | 0.1 | 0.8 | 4.7 | 0.1 |
| Statistical discrepancy (I) | na | na | - | na | na | 0.2 |
| Gross domestic product | 0.5 | 2.2 | 0.5 | 0.5 | 2.1 | 0.5 |
|
| - nil or rounded to zero (including null cells) |
| na not available |
| (a) Includes Public non-financial corporations, Financial corporations, General government and Dwellings owned by persons. |
MARCH QUARTER
Summary Comments
Compensation of employees (COE)
- Seasonally adjusted COE increased 0.8%, reflecting an increase of 0.4% in average earnings per employee.
- Private sector COE rose 0.8% and the public sector COE rose 0.9%. The largest increases were recorded for the Professional, scientific and technical services, and Construction industries.
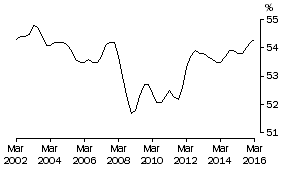
- Trend COE represented 54.3% of Total factor income.
COE SHARE OF TOTAL FACTOR INCOME: Trend
Gross operating surplus (GOS)
- Total seasonally adjusted GOS decreased 0.9% for the March quarter. Seasonally adjusted Total corporations GOS decreased 1.7%. The main detractor was Private non-financial corporations (-2.9%), partially offset by Financial corporations (0.7%) and Public non-financial corporations (4.7%).
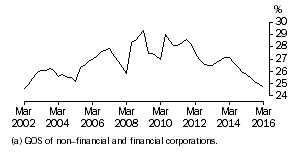
- Trend GOS for Total corporations represented 24.7% of Total factor income.
Profit (a) Share of Total Factor Income: Trend
 Quality Declaration
  Print Page
 Print All