|
|
CHAPTER 5 - FEASIBILITY STUDY: INCOME AND WEALTH, 2013-14
To determine the robustness of the methodology used to extrapolate the 2014-15 estimates of the distributional data, a feasibility study was undertaken by comparing 2013-14 distributional data for income, wealth and STiK using actual ABS Survey of Income and Housing (SIH) data from 2013-14 versus modelled micro distributional data using linear interpolation (extrapolation). For more detail regarding the model, see Chapter 4, "Time Series Presentation". Due to the lack of timely HES data, the robustness of the modelled consumption estimates was not tested.
A significant amount of analysis may be undertaken to test the robustness of the modelled estimates. For this study an analysis was undertaken on how the modelled data performed for each of the five household indicators (main source of income; equivalised income quintiles; household composition; age of household reference person; and equivalised net worth quintiles) by estimating:
(a) total share of income and wealth components and aggregates; and
(b) growth rates of the levels of income and wealth components and aggregates. In addition to providing insight into the accuracy of growth rates of items between time periods, the analysis provides insight into the accuracy of the levels reported for each item within household groups. When analysing the accuracy of the growth rates, the contribution of the individual household group to the estimate needs to be taken into account.
INCOME
Analysis was undertaken for adjusted disposable income (ADI) (see Graphs 5.1 to 5.5), compensation of employees (COE), gross mixed income (GMI) , gross operating surplus (GOS) - dwellings owned by persons, property income receivable, social assistance benefits, interest payable, income tax payable and social transfers in kind (STiK). See Appendix 1, for the income component graphs in the Explanatory Notes tab of this publication.
Graph 5.1: Adjusted Disposable Income. Main Source of Income, Share of Total, 2013-14 and Growth Rate, 2011-12 to 2013-14
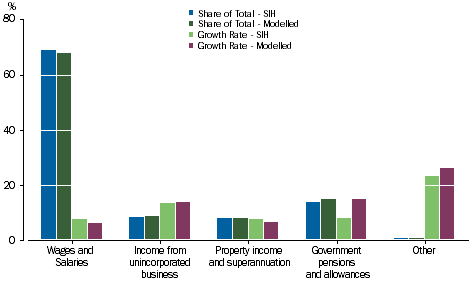
Graph 5.1, illustrates that for ADI by main source of income (MSI), the modelled and SIH total share of ADI display similar distributive patterns, and the actual amount of the total shares are closely aligned for each household group. For the growth rate, the modelled and SIH results are closely aligned with the exception of households with MSI government pensions and allowance and MSI other.
For the modelled and SIH total share for income components, similar distributive patterns and the amount of total share of the components are displayed for all income components, with the exception of GOS - dwelling owned by persons, GMI and Taxes payable:
- GOS - dwelling owned by persons, modelled estimates overstate the share of households with MSI government pension and allowance by nearly 7% and understate by the same amount for households with MSI wages and salaries;
- GMI, modelled estimates understate the share of households with MSI property and superannuation by approximately 6% and overstate households with MSI income from unincorporated business by 8%; and
- Taxes payable, modelled estimates understate the share of households with MSI property and superannuation by approximately 5% and overstate households with MSI income wages and salaries by 7%.
For the growth rates between modelled and SIH for income components:
- COE, for MSI wages and salary households which contribute nearly 96% of the total, the growth rates are well aligned.
- GOS dwelling owned by person, there is good alignment for households MSI property and superannuation, but for all other household groups there are significant differences in growth rates, with MSI wages and salary households showing different signs in the growth rates;
- GMI, there is good alignment for households MSI wages and salaries, but for all other household groups there are significant differences in growth rates, and with most groups showing different signs in the growth rates;
- Property income receivable, for all household groups there are significant differences in growth rates, and households with MSI property and superannuation which contribute nearly 30% of the share show different signs in the growth rates;
- Social assistance benefits, there is good alignment for households with MSI government pensions and allowance, which receive 55% of social assistance benefits;
- Interest payable, there is good alignment for households with MSI wages and salaries, income from unincorporated business and property and superannuation, which pay collectively 95% of the interest payable;
- Income tax payable, for all household groups there are significant differences in growth rates, and households with MSI wages and salaries which contribute over 80%, the modelled growth rate are approximately 8.0% over the SIH estimate; and
- STiK, there is good alignment for households with MSI wages and salaries and MSI government pensions and allowance, which receive 53% and 32% respectively of STiK.
Graph 5.2: Adjusted Disposable Income. Equivalised Income Quintile, Share of Total, 2013-14 and Growth Rate, 2011-12 to 2013-14
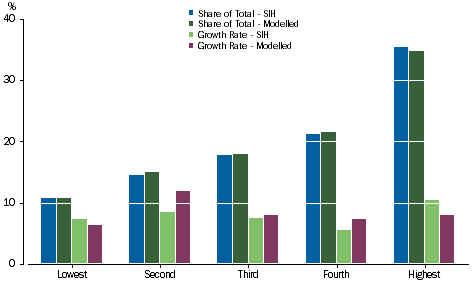
Graph 5.2, illustrates that for ADI by equivalised income quintiles, the modelled and SIH total share of ADI display similar distributive patterns and the actual amount of the total shares are closely aligned for each quintile. For the growth rate, the modelled and SIH results are moderately aligned with the exception of households in the second quintile; the difference in the growth rate is 3.5%.
For the modelled and SIH, total share for income components, similar distributive patterns and amount of the total share of the components are displayed for all income components with the exception of GOS - dwelling owned by persons. For this component, the second and third quintile, the modelled estimates understate the share of households by 5% and 2.5% respectively and overstate the highest quintile by 8%.
For the growth rates between modelled and SIH for income components:
- COE, the growth rates are well aligned, with the exception of the second quintile where the modelled estimate understate the growth rate by 6% and the fourth quintile where the modelled estimate overstate the growth rate by 4%:
- GOS - dwelling owned by person, there is good alignment for the fourth quintile, but for all other quintiles there are significant differences in growth rates, with the highest quintile showing different signs in the growth rates;
- GMI, there is good alignment for the second and highest quintile, but for all other quintiles there are significant differences with growth rates, with the lowest and fourth quintile showing different signs in the growth rates;
- Property income receivable, there is good alignment for the lowest, third and highest quintile. The second quintile shows significant differences in growth rates, and the fourth quintile shows different signs in the growth rates;
- Social assistance benefits, moderate alignment for all quintiles, with the modelled estimates overstating the growth rate of the third, fourth and highest quintile by 5%, 10% and 4% respectively;
- Interest payable, there is moderate alignment for all quintiles, with good alignment for the fourth quintile:
- Income tax payable, there is moderate alignment for the second, third and highest quintile and the lowest and fourth quintile show different signs in the growth rates; and.
- STiK, there is good alignment for the lowest, third and fourth quintile and moderate alignment for the second and highest quintile.
Graph 5.3: Adjusted Disposable Income. Household Characteristics, Share of Total, 2013-14 and Growth Rate, 2011-12 to 2013-14
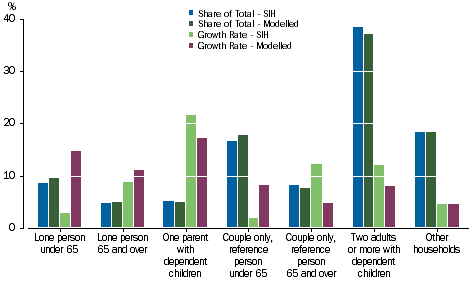
Graph 5.3, illustrates that for ADI by household composition, the modelled and SIH total share of ADI display similar distributive patterns and the actual amount of the total shares are closely aligned for each household group. For the growth rate, the modelled and SIH results are well aligned for households with lone person 65 years and over and other households; moderately aligned for households with one parent with dependent children and households with two adults or more with dependent children; and for the rest of the household groups the alignment is not as good.
For the modelled and SIH total share for income components, similar distributive patterns and amount of the total share of the components are displayed for all income components, with the exception of GOS - dwelling owned by persons and GMI:
- GOS dwelling owned by persons, modelled estimates understate the share of households with lone person under 65 years and over 65 years, by approximately 3 % and 4% respectively; and overstate the share by 10% for households with two adults or more with dependent children.
- GMI, modelled estimates understate the share of households with one parent with dependent children and couple only, reference person 65 years and over by 3% and 4.5% respectively; and overstate the share by 9% for households with couple only, reference person under 65 years.
For the growth rates between modelled and SIH for income components:
- COE, there is good alignment for households with couple only reference person under 65 years, but for the rest of the household groups there are significant differences in growth rates, and households with a lone person 65 years and over and other households show different signs for the growth rates;
- GOS - dwelling owned by person, there is good alignment for households with couple only, reference person under 65 years and over 65 years but for the rest of the household groups there are significant differences in growth rates, and households with a lone person 65 years and under and households with two adults or more with dependent children show different signs in the growth rates;
- GMI, there is good alignment for households with two adults or more with dependent children but for the rest of the household groups there are significant differences in growth rates and households with couple only, reference person over 65 years show different signs in the growth rates;
- Property income receivable, there is good alignment for households with two adults or more with dependent children but for the rest of the household groups there are significant differences in growth rates, and for households with lone person under 65 years show different signs in the growth rates;
- Social assistance benefits, there is good alignment for households with couple only, reference person over 65 years but for the rest of the household groups there are significant differences in growth rates;
- Interest payable, there is good alignment for households with couple only, reference person under 65 years and other households, but for the rest of the household groups there are significant differences in growth rates, and for households with lone person over 65 years and households with couple only, reference person over 65 years show different signs in the growth rates;
- Income tax payable, there is good alignment for households with two adults or more with dependent children and other households but for the rest of the household groups there are significant differences in growth rates, and for households with lone person over 65 years and couple only, reference person under 65 years households show different signs in the growth rates; and
- STiK, there is good alignment for households with couple only, reference person over 65 years and households with two adults or more with dependent children but for the rest of the household groups there are significant differences in growth rates, and the growth rates for other households show different signs.
Graph 5.4: Adjusted Disposable Income. Age of Reference Person, Share of Total, 2013-14 and Growth Rate, 2011-12 to 2013-14
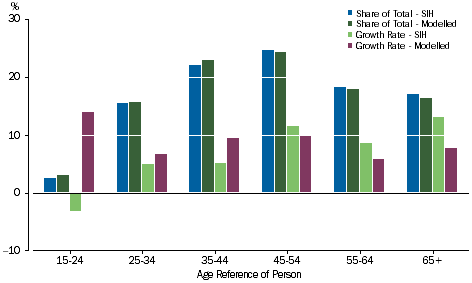
Graph 5.4, illustrates that for ADI by age of reference person, the modelled and SIH total share of ADI display similar distributive patterns and the actual amount of the total shares are closely aligned for each household group. For the growth rate, the modelled and SIH results are well aligned for households with age of reference person 25-34 years and households with age of reference of person 45-54 years; moderately aligned for households with age of reference of person 35-44 years and households with age of reference of person 55-64 years; for households with age of reference 65 years and over, the difference in the growth rates is just over 5%; and for households with age of reference 15-24 years the growth rates show different signs.
For the modelled and SIH total share for income components, similar distributive patterns and amount of the total share of the components are displayed for all income components, with the exception of GOS - dwelling owned by persons and GMI:
- GOS - dwelling owned by persons, modelled estimates understate the share of households with age of reference person 45-54 years by approximately 4.5 % and overstate the share by 5% for households with age of reference 65 years and over;
- GMI, modelled estimates understate the share of households with age of reference 45-54 years and households with age of reference 65 years and over, 7% and 5% respectively; and overstate the share of households with age of reference 25-34 years and households with age of reference 55-64 years, 6% and 4.5% respectively.
For the growth rates between modelled and SIH for income components:
- COE, there is good alignment for households with age of reference 25-34 years and households with age of reference 55-64 years, but for the rest of the household groups there are significant differences in growth rates, and households with age of reference 15-24 years show different signs for the growth rates;
- GOS - dwelling owned by person, there is good alignment for households with age of reference 55-64 years but for the rest of the household groups there are significant differences in growth rates, and households with age of reference 15-24 years show different signs in the growth rates;
- GMI, for all household groups there are significant differences in growth rates, and households with age of reference 35-44 years and households with age of reference 65 years and over, show different signs in the growth rates;
- Property income receivable, there is good alignment for households with age of reference 55-64 years but for the rest of the household groups there are significant differences in growth rates, and households with age of reference 25-34 years show different signs in the growth rates;
- Social assistance benefits, there is good alignment for households with age of reference 25-34 years but for the rest of the household groups there are significant differences in growth rates;
- Interest payable, there is good alignment for households with age of reference 55-64 years but for the rest of the household groups there are significant differences in growth rates, and households with age of reference 25-34 years showing different signs in the growth rates;
- Income tax payable, for all household groups there are significant differences in growth rates, and households with age of reference 15-24 years and households with age of reference 25-34 years, showing different signs in the growth rates;
- STiK, there is good alignment for households age of reference 25-34 years, households with age of reference 45-54 years and households with age of reference 55-64 years but for the rest of the household groups significant differences in growth rates.
Graph 5.5: Adjusted Disposable Income. Equivalised Net Worth Quintiles, Share of Total, 2013-14 and Growth Rate, 2011-12 to 2013-14
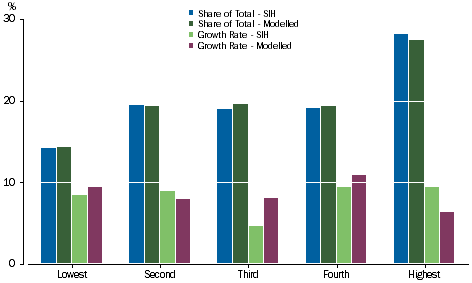
Graph 5.5, illustrates that for ADI by equivalised net worth quintiles, the modelled and SIH total share of ADI display similar distributive patterns and the actual amount of the total shares are closely aligned for each quintile. For the growth rate, the modelled and SIH results are well aligned for the lowest quintile, moderately aligned for the second and fourth quintile, and the difference in the growth rate is 4.6%.for the third quintile and 3% for the highest quintile.
For the modelled and SIH total share for income components, similar distributive patterns and the amount of total share of the components are displayed for all income components, with the exception of GOS - dwelling owned by persons, GMI and Taxes payable:
- GOS - dwelling owned by persons, modelled estimates overstate the share of households in the lowest quintile by over 3% and understate by 5% the share of households in the highest quintile;
- GMI, modelled estimates overstate the share for households in the second, third and fourth quintiles by 3%, 2% and 3% respectively and overstate the shares in households in the lowest and highest quintiles by 3% and 5.5% respectively;
- Taxes payable, modelled estimates overstate the share for households in the third quintile by 2.5%, and overstate the share in the households in the highest quintile by 5.5%.
For the growth rates between modelled and SIH for income components:
- COE, the growth rates are well aligned, with the exception of the third quintile where the modelled estimate overstate the growth rate by 4% and the highest quintile where the modelled estimate understate the growth rate by 3%;
- GOS - dwelling owned by person, there is good alignment for households in the third and fourth quintiles, but for all other quintiles there are significant differences in growth rates, and the lowest quintile shows different signs in the growth rates;
- GMI, for all quintiles, there are significant differences in growth rates, with the fourth quintile showing different signs in the growth rates;
- Property income receivable, there is good alignment for households in the highest quintile, but for all other quintiles there are significant differences in growth rates, and households in the lowest and third quintile show different signs in the growth rates;
- Social assistance benefits, there is good alignment for households in all quintiles with the exception of the highest quintile which has a difference in growth rate of 5%;
- Interest payable, there is good alignment for the third, fourth and fifth quintile and the second quintile has a difference in growth rate of 6%; and the difference in growth rates for the lowest quintile is significant;
- Income tax payable, there is good alignment for the lowest quintile, and for the rest of the quintiles there are significant differences in growth rates, and households in the third quintile show different signs in the growth rates; and
- STiK, there is good alignment for the lowest, third and highest quintiles and moderate alignment for the second and fourth quintile.
WEALTH
Analysis was undertaken for net worth (see Graphs 5. 6 to 5.10); residential dwelling and land; financial assets broken down to currency and deposits, shares and other equity and insurance technical reserves; and loan liabilities. See Appendix 2, for net worth component graphs in the Explanatory Notes tab of this publication.
Graph 5.6: Net Worth. Main Source of Income, Share of Total, 2013-14 and Growth Rate, 2011-12 to 2013-14
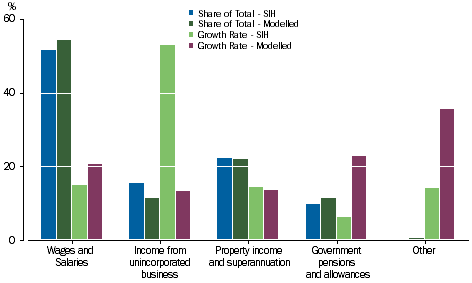
Graph 5.6, illustrates that for net worth by MSI, the modelled and SIH total share of net worth display similar distributive patterns and the actual amount of the total shares are closely aligned for each household group, with the exception of MSI wages and salaries overestimating the shares by 3% and MSI income from unincorporated business overstating the shares by 4%. For the growth rate, the modelled and SIH results are well aligned for MSI property income and superannuation and moderately aligned for MSI wages and salaries, with the latter group differential in growth rate being approximately 6%. The rest of the household groups have significant differences in the growth rates.
For the modelled and SIH total share for net worth components, similar distributive patterns and amount of the total share of the components are displayed for all net worth components, with the exception of shares and other equity. For shares and other equity, modelled estimates overstate the share of households with MSI wages and salaries and MSI property income and superannuation by 4% and 12 % respectively, and understate MSI income from unincorporated business and MSI government pensions and allowances by 7% and 9% respectively.
For the growth rates between modelled and SIH for net worth components:
- Residential dwelling and land, there is good alignment for MSI wages and salary households and MSI other households, but for all other household groups there are moderate to significant differences in growth rates;
- Currency and deposits, there is good alignment for households MSI wages and salaries, but for the rest of the household groups there are significant differences in growth rates, with MSI income from unincorporated business and MSI other showing different signs in the growth rates;
- Shares and other equity, there are significant differences in growth rates in all MSI household groups, with MSI wages and salaries households showing different signs in the growth rates;
- Insurance technical reserves, there is good alignment for MSI wages and salaries and MSI property income and superannuation with rest of the MSI household group showing significant differences in growth rates; and
- Loan liabilities, good alignment for all MSI household groups with the exception of MSI other, which is not a significant MSI household group.
Graph 5.7: Net Worth. Equivalised Income Quintiles, Share of Total, 2013-14 and Growth Rate, 2011-12 to 2013-14
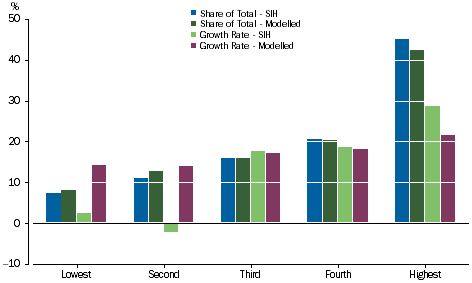
Graph 5.7, illustrates that for net worth by equivalised income quintiles, the modelled and the SIH total share of net worth display similar distributive patterns and the actual amount of the total shares are closely aligned for each household group. For the growth rate, the modelled and SIH results are well aligned for the third and fourth quintile. The highest quintile shows differences in growth rates of 7%, and the lowest and second quintile show significant differences in the growth rates, with the second quintile showing different signs.
For the modelled and the SIH total share for net worth components, similar distributive patterns and the amount of total share of the components are displayed for all net worth components, with the exception of shares and other equity. For shares and other equity, modelled estimates overstate the share of the highest quintile, and understate all other quintiles.
For the growth rates between modelled and SIH for net worth components:
- Residential dwelling and land, there is good alignment for the third and fourth quintiles, but for all other quintiles there are significant differences in growth rates, with the lowest quintile showing different signs in the growth rates;
- Currency and deposits, there is good alignment for the fourth and highest quintile, but for the rest of the quintiles there are large differences in growth rates;
- Shares and other equity, there is good alignment for the third and highest quintiles, but for all other quintiles there are significant differences in growth rates, with the second quintile showing different signs in the growth rates;
- Insurance technical reserves, there is good alignment for all quintiles with the exception of the fourth quintile which shows the modelled estimate overstating the growth rate by 8%; and
- Loan liabilities, there is good alignment for the third and fourth quintiles, but for all other quintiles there are significant differences in growth rates, with the lowest quintile showing different signs in the growth rates.
Graph 5.8: Net Worth. Household Composition, Share of Total, 2013-14 and Growth Rate, 2011-12 to 2013-14
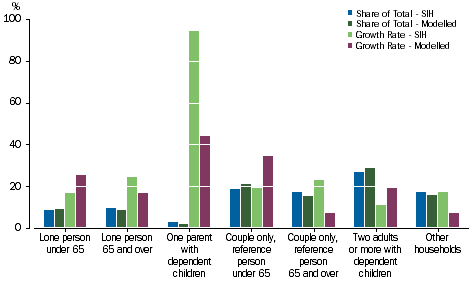
Graph 5.8, illustrates that for net worth by household composition, the modelled and SIH total share of net worth display similar distributive patterns and the actual amount of the total shares are well aligned for each household group. The differences in the growth rate between the modelled and SIH results range from 8% to 50%, but it needs to be noted when taking account of these growth rates, relative weights of each household group need to be taken into account.
For the modelled and SIH total share for net worth components, similar distributive patterns and amount of the total share of the components are displayed for all net worth components, with the exception of shares and other equity. For shares and other equity, modelled estimates are closely aligned for households with a lone person under and over 65 years. The modelled estimates overstate the share of couple only, reference person over 65 years and two adults or more with dependent children, total share understate for all other household categories not already mentioned.
For the growth rates between modelled and SIH for net worth components:
- Residential dwelling and land, for all the household groups, the absolute differences range from 4% to 16%;
- Currency and deposits, for all the household groups, the absolute differences range from 4% to 215%, as noted above, the relative weights need to be taken into account when assessing this result;
- Shares and other equity, for all the household groups, the absolute differences range from 16% to 86%, and for households with two adults or more with dependent children showing different signs in the growth rates;
- Insurance technical reserves, there is good alignment for households with couple only, reference person under 65 years, households with two adults or more with dependent children and other households. For the rest of the household groups there are quite significant differences in growth rates; and
- Loan liabilities, for all the household groups, the absolute differences range from 4% to 43%, and for households with a lone person under 65 years, one parent with dependent children households and other households showing different signs in the growth rates.
Graph 5.9: Net Worth. Age of Reference Person, Share of Total, 2013-14 and Growth Rate, 2011-12 to 2013-14

Graph 5.9, illustrates that for net worth by age of reference person, the modelled and SIH total share of net worth display similar distributive patterns and the actual amount of the total shares are well aligned for each household group. The difference in the growth rates between the modelled and SIH results range from 5% to 25%. It needs to be noted that for these growth rates, relative weights of each household group need to be taken into account. For households with age of reference 15-24 years, the growth rates show different signs.
For the modelled and SIH total share for wealth components, similar distributive patterns and the amount of the total share of the components are displayed for all net worth components, with the exception of shares and other equity. For shares and other equity, modelled estimates are closely aligned for households with age of reference person 55-64 years. The modelled estimates overstate the share of households with reference person 35-44 and 45-54 years. For all other household categories not already mentioned, the total shares are understated.
For the growth rates between modelled and SIH for net worth components:
- Residential dwelling and land, there is good alignment for households with reference person 45-54 years. For all the household groups, the absolute differences range from 0.5 % to 60%;
- Currency and deposits, for all the household groups, the absolute differences range from 5% to 19%;
- Shares and other equity, for all the household groups, the absolute differences range from 13% to 50% , and for households with age of reference 15-24 years and households with age of reference 35-44 years, show different signs in the growth rates;
- Insurance technical reserves, for all the household groups, the absolute differences range from 11% to 27%; and
- Loan liabilities, for all the household groups, the absolute differences range from 4% to 60%.
Graph 5.10: Net Worth, Equivalised Net Worth Quintiles, Share of Total, 2013-14 and Growth Rate, 2011-12 to 2013-14
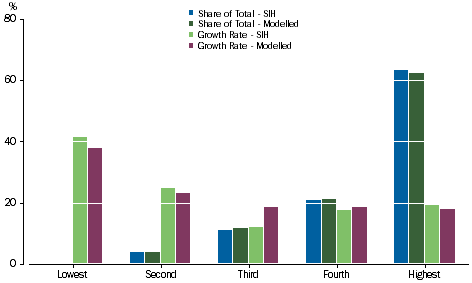
Graph 5.10, illustrates that for net worth by equivalised net worth quintiles, the modelled and SIH total share of net worth display similar distributive pattern and the actual amount of the total shares are closely aligned for each quintile. For the growth rate, the modelled and SIH results are well aligned for the second, fourth and highest quintile and the difference in the growth rate is 3.5 %.for the lowest quintile and 7% for the third quintile.
For the modelled and SIH total share for wealth components, similar distributive patterns and the amount of the total share of the components are displayed for all net worth components, with the exception of shares and other equity. For shares and other equity, modelled estimates understate the share of households in the lowest, second, third and fourth quintiles and overstate the highest quintile.
For the growth rates between modelled and SIH for wealth components:
- Residential dwelling and land, the growth rates are well aligned, with the exception of the lowest quintile where the modelled estimate understate the growth rate by 15% and the second quintile where the modelled estimate overstate the growth rate by 5%;
- Currency and deposits, there is good alignment for households in the second and fourth quintiles. For households in the lowest quintile, third and highest quintiles, the absolute difference in the growth rates are 8%, 17% and 4% respectively;
- Shares and other equity, for all the household groups, the absolute differences range from 7% to 79%, and for households in the lowest quintile showing different signs in the growth rates;
- Insurance technical reserves, there is good alignment for households in the second, fourth and highest quintiles. For households in the lowest and third quintiles, the absolute difference in the growth rates are 10% and 7% respectively; and
- Loan liabilities, there is good alignment for households in the third and fourth quintiles. For households in the lowest, second and highest quintiles, the absolute difference in the growth rates are 9%, 9% and 5% respectively.
CONCLUSION
The feasibility study for the distribution of the five household indicators showed that for the aggregate adjusted disposable income (ADI) and net worth, there was good alignment between the SIH and modelled estimates, but for the components of ADI and net worth, the alignment was less than for the aggregates. The study produced the following results:
- modelled estimates for the share of aggregate ADI aligned closely to the SIH results in terms of the pattern of the distribution and size of the shares for household indicators;
- modelled estimates of the shares of COE, property income receivable, social assistance benefits, interest payable and STIK aligned closely to the SIH results (pattern and size), whereas for GOS-dwelling, GMI and taxes payable, the alignment was not as close, and for some household indicators differences were significant compared to the SIH results;
- modelled estimates for the share of aggregate net worth aligned closely to the SIH results in terms of the pattern of the distribution and size of the shares for all household indicators with the exception of main source of income;
- modelled estimates for the share of residential dwelling and land, total financial assets, currency and deposits, insurance technical reserves and loan liabilities aligned closely to the SIH results in terms of the pattern of the distribution and size for all household indicators. However, alignment for the financial asset - shares and other equity was not as close for all household indicators;
- modelled estimates for the growth rate of aggregate ADI and net worth, the alignment to the SIH results were mixed, however users are reminded to take the weights of the individual household groups into account when assessing the alignment of the household indicators; and
- modelled estimates for the growth rate of the components of ADI and net worth, the alignment to the SIH results were mixed, however users are reminded to take the weights of the individual household groups into account when assessing the alignment of the household indicators.
The feasibility study provides users some insights into assessing the robustness of the modelled distributed income and wealth estimates in this release. In particular, it provides users some insights into the modelled estimates for the latest 2014-15 year. Users should bear in mind when making an assessment, that the latest available SIH results used in the model for 2014-15 were from 2013-14, a gap of only one year. It is expected that the modelled estimates for 2014-15 would be more accurate due to the one year gap as opposed to the data in the feasibility study where the modelled estimates were two years away from the latest SIH results.
WAY FORWARD
The study used simple linear forecasting models to estimate the missing micro household distributional data. It may be possible in the future with the assistance of the ABS experts in the field of time series modelling to use more sophisticated statistical modelling techniques that do not assume linear relationships in the data points. There are two approaches that could be explored:
(i) Auto-regressive Integrated Moving Average (ARIMA) - model requires existing historical data to create a forecast model; and
(ii) Models incorporating auxiliary data - forecast based on highly correlated information from alternative data sources. For example income items may be forecasted using Personal Income Tax (PIT) data, employment data and other types of socio-demographic information.
|
|
 Print Page
 Print All