USING THE TABLEBUILDER
ABOUT THE TABLEBUILDER
EXAMPLE: USING MULTIPLE RESPONSE DATA ITEMS
EXAMPLE: A TABLE USING SUB-PERSON LEVEL DATA ITEMS
CONFIDENTIALITY
ABOUT THE TABLEBUILDER
For general information relating to the TableBuilder or instructions on how to use features of the TableBuilder product, please refer to the User Manual: TableBuilder (cat. no. 1406.0.55.005).
The 2015 SDAC TableBuilder dataset contains nine of the ten levels of data applicable to the SDAC. Information about these levels are detailed in the File Structure section. The Data Item Lists document on the Summary tab contains information about the TableBuilder data item list, which is available as an Excel spreadsheet on the Downloads tab.
Level 8 (All Recipients), has not been released in TableBuilder due to the complexity involved in using and interpreting data on this level. Unlike other sub-person levels, the All Recipients level contains a ‘many to many’ relationship. This describes the ability for a ‘Recipient of care’ to have multiple 'Carers', while a 'Carer' can also have multiple ‘Recipients of care’. To discuss your data needs relating to this level, please contact the ABS National Information Referral Service (NIRS) on 1300 135 070.
MULTIPLE RESPONSE DATA ITEMS
A number of data items produced from the Survey of Disability, Ageing and Carers (SDAC) allow a respondent to provide more than one response. These are referred to as multiple response data items. An example of one of these items being used within the TableBuilder is shown below.
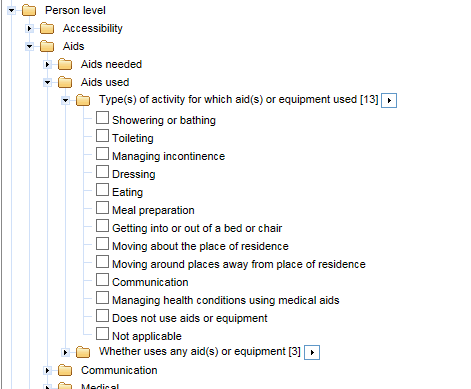
In this example, a series of questions is asked in the survey, relating to each activity, in order to produce the data item 'Type(s) of activity for which aid(s) or equipment used'. Responses to these questions determine whether an aid or equipment is used for a given activity. A person may indicate the use of an aid or equipment for more than one activity, meaning they have supplied multiple responses to this data item.
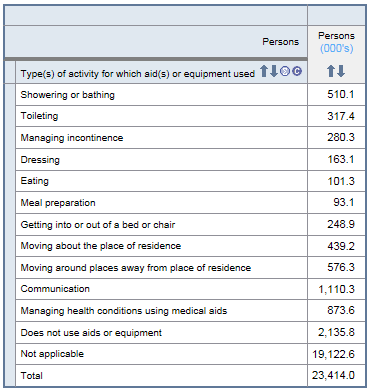
When a multiple response data item is tabulated, a person is counted against each category, for which they have provided a response (e.g. a person who uses an aid(s) or equipment for Toileting, Dressing and Eating will be counted against each of these three categories).
Similar to a single response data item, a person not within the appropriate population will fall into the ‘Not Applicable’ category (e.g. a person without a disability is not asked about their use of an aid or equipment and is therefore considered ‘Not Applicable’ for this data item).
A category exists for persons who are in scope of the population, but do not provide a valid response to any other categories (i.e. a person requiring assistance for one or more activities, but who does not use an aid or equipment for any activities will fall into the category ‘Does not use aids or equipment’).
Therefore, each person in the appropriate population is counted at least once, while some persons are counted multiple times. The total for multiple response data items is therefore less than or equal to the sum of its components. In the example below, the sum of the components is 25,972.0
SUB-PERSON LEVEL DATA ITEMS
In SDAC, an individual person can be represented multiple times within a sub-person level, depending on the number of instances in which they meet the criteria for that level. Sub-person levels are said to have a 'one to many' relationship. For example, a single individual who reported multiple health conditions on the Person level would contribute multiple records to the All conditions level, equal to the number of health conditions they reported.
Care needs to be taken when interpreting tables, where data items have been included from both person and sub-person levels.
The table below draws upon ‘Whether has a disability’ from the Person level and ‘Extent to which need for assistance is met’ from the Broad activities level. This table is followed by a practical demonstration of how estimates may be derived when using sub-person levels.
Note: In order for a person to contribute record(s) to the Broad Activities
level they must experience difficulty with
one or more broad activities. A record is created for each activity where the person experiences difficulty.
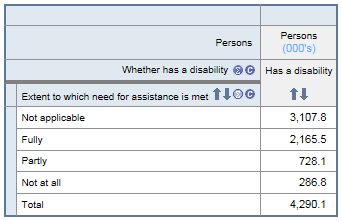
In the table above, the sum of the components is far greater than the total (6,288.2 versus 4,290.1). This is because, for each activity where a person experiences difficulty, a response is required for the item ‘Extent to which need for assistance is met’. A person can experience difficulty in multiple activities and can therefore contribute more than one record to the response categories for this item (i.e. Fully, Partly, Not at all and Not applicable).
The ‘Total’ refers to the number of persons contributing to the table and is derived from the Person level item ‘Whether has a disability’. Only
one record can be attributed to a Person level item, unless the response categories for that item allow multiple responses.
An example of how this table is derived is shown below, where the population consists of just one person:
| Table a) Person level – 1 record / person exists |
| Data item: Whether has a disability? |
| Category 1) Has a disability | Yes |
| Category 2) Does not have a disability | - |
 |
| 10 x Data items: Whether needs assistance or has difficulty with… |
| 1) Mobility? | Yes |
| 2) Self-care? | - |
| 3) Oral communication? | - |
| 4) Health care? | Yes |
| 5) Cognitive or emotional tasks? | Yes |
| 6) Household chores? | - |
| 7) Property maintenance? | Yes |
| 8) Meal preparation? | Yes |
| 9) Reading or writing? | - |
| 10) Private transport? | - |
Table b) Broad activities level – 5 records exist
(derived from 10 x Person level data items) |
| Data item: Extent to which need for assistance is met? |
| Activity
(Records 1 to 5) | Category 1 | Category 2 | Category 3 | Category 4 |
Fully | Partly | Not at all | Not applicable |
| Record 1: Mobility | Yes | - | - | - |
| Record 2: Health care | - | - | Yes | - |
| Record 3: Cognitive or emotional tasks | - | - | Yes | - |
| Record 4: Property maintenance | - | - | - | Yes |
| Record 5: Meal preparation | - | - | - | Yes |
| Table c) Whether has a disability: | Has a disability |
| Data item: Extent to which need for assistance is met? |
| Fully | 1 |
| Partly | 0 |
| Not at all | 2 |
| Not applicable | 2 |
| Total | 1 |
Note re Table c:
- The total population for this table is one person, representing the number of applicable Person level records for the item ‘Whether has a disability’ (i.e. those who have a disability).
- The sum of the components for this table is five records, representing the number of instances on the Broad activities level where a person experienced difficulty or needed assistance with an activity. These were derived from the ten Person level data items.
- The applicable population for this table is three, representing the records (activities) where the person indicated experiencing difficulty and needing assistance (i.e. mobility, health care and cognitive or emotional tasks).
- The ‘not applicable’ population for this table is two, representing the records (activities) where the person indicated experiencing difficulty but not needing assistance (i.e. property maintenance and meal preparation). These two records are on the Broad activities level but do not apply to the data item ‘Extent to which need for assistance is met‘.
CONFIDENTIALITY
In accordance with the Census and Statistics Act 1905, all estimates are subjected to a confidentiality process before release. This confidentiality process is undertaken to avoid releasing information that may allow the identification of particular individuals, families, households, dwellings or businesses.
Processes used in TableBuilder to confidentialise records include the following:
- perturbation of data
- table suppression
- top coding and min/max values
Perturbation of data
To minimise the risk of identifying individuals in aggregate statistics, a technique is used to randomly adjust cell values. This technique is called perturbation. Perturbation involves small random adjustments of the statistics and is considered the most satisfactory technique for avoiding the release of identifiable statistics while maximising the range of information that can be released. These adjustments have a negligible impact on the underlying pattern of the statistics.
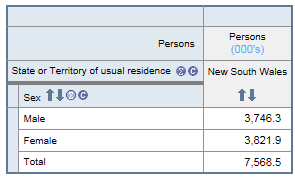
The introduction of these random adjustments will result in tables not summing to totals. Randomly adjusted individual cells will be consistent across tables, but the totals in any table will not be the sum of the individual cell values. The size of the difference between summed cells and the relevant total will generally be very small, as demonstrated below.
The introduction of perturbation in publications ensures that estimates produced in TableBuilder are consistent with published statistics. The estimates of error produced using TableBuilder may show small differences relative to published estimates of error. These differences are not statistically significant.
Table suppression
Some tables generated within TableBuilder may contain a substantial proportion of very low counts within cells (excluding cells that have counts of zero). When this occurs, all values within the table are suppressed in order to preserve confidentiality. The following error message displayed at the bottom of the table indicates when table suppression has occurred.
ERROR: The table has been suppressed as it is too sparse.
ERROR: table cell values have been suppressed.
Top coding and min/max values
As part of the confidentiality process, a number of data items have minimum or maximum values or top coding applied to minimise the risk of identification.
Weight Variables
Five benchmarked weights are provided with the SDAC TableBuilder: ‘Households’, ‘Families’, ‘Income units’, ‘Persons’ and ‘Restrictions’. ‘Persons’ is the default summation, which means that this weight is automatically added to the row of any table. In TableBuilder, these weights can be found under the Summation Options category in the left hand pane. TableBuilder only allows one weight to be used at a time.
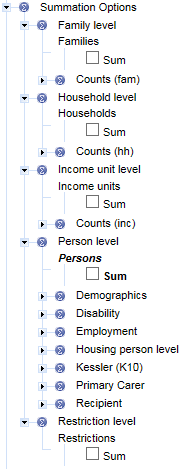
When analysing a Household, Family, Income unit or Restrictions level item, you may want to change the summation weight from Person to the one appropriate for the item level - for example, if you wanted to know the number of households in a state, rather than the number of persons living in that state. In this case you would add the weight called ‘Households’ from the Summation Options heading.
Caution should be used when applying weights other than the default summation to items from other levels. Household, Family, Income Unit and Restrictions weights should only be used for their specified levels. For example, if the household weight is applied to a selected Person level demographic item, such as ‘Sex’, your table will show the number of households with one or more selected persons of that sex. Since several people in each household can be selected in the SDAC, this will result in some households being counted twice, once for females and once for males.
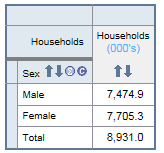
For sub-person levels, excluding the Restrictions level, the Person level (default summation weight) should be used.
 Print Page
 Print All
 Quality Declaration