|
|
QUEENSLAND
MEDIAN AGE
- At June 2017, the median age (the age at which half the population is older and half is younger) of Queensland's population was 37.1 years, up from 36.6 years at June 2012. The median age of males in 2017 was 36.4 years compared with 37.9 years for females.
- The median age of the population in Greater Brisbane was 35.3 years at June 2017, up slightly from 35.0 at June 2012, while the median age in the rest of Queensland increased from 38.2 to 39.2 years over the same period.
- The SA2 with the highest median age was Bribie Island (59.6 years) in the Moreton Bay region. This was followed by Cooloola (58.5) in the Wide Bay region, and Redland Islands (56.1) in Brisbane's east.
- The two SA2s with the lowest median ages had predominantly Aboriginal and Torres Strait Islander populations. These were Northern Peninsula (22.4 years) in the far north of the state and Yarrabah (22.7) near Cairns. Other SA2s with comparatively low median ages included St Lucia (23.9) in Greater Brisbane and Douglas (24.6) in Townsville. This reflects large numbers of university students in these areas.
SA2s WITH OLDEST AND YOUNGEST MEDIAN AGES(a), Queensland, 2017
|
|
 |  | Median Age |
| SA2 | GCCSA | years |
OLDEST MEDIAN AGES |
|
| Bribie Island | Greater Brisbane | 59.6 |
| Cooloola | Rest of Qld | 58.5 |
| Redland Islands | Greater Brisbane | 56.1 |
| Magnetic Island | Rest of Qld. | 54.3 |
| Caloundra - Kings Beach | Rest of Qld | 54.2 |
YOUNGEST MEDIAN AGES |
|
| Northern Peninsula | Rest of Qld | 22.4 |
| Yarrabah | Rest of Qld | 22.7 |
| St Lucia | Greater Brisbane | 23.9 |
| Douglas | Rest of Qld | 24.6 |
| Torres Strait Islands | Rest of Qld | 24.8 |
|
| (a) Excludes SA2s with a population of less than 1,000 at June 2017. |
SEX RATIO
- At June 2017, the sex ratio (the number of males per 100 females) in Queensland was 98.3. Females outnumbered males in both Greater Brisbane (with a sex ratio of 98.1) and the rest of Queensland (98.4).
- The SA2 with the highest sex ratio was Wacol (241.2 males per 100 females), which contains a male prison. This was followed by Tablelands (151.9) in the state's far north and Broadsound - Nebo (133.5) in the Bowen Basin region.
- The SA2s with the lowest sex ratios were Millbank - Avoca (86.5), a suburb of Bundaberg, and Buderim - North (87.3) on the Sunshine Coast.
SA2s WITH HIGHEST AND LOWEST SEX RATIOS(a), Queensland, 2017
|
|
 |  | Sex Ratio |
| SA2 | GCCSA | males per 100 females |
HIGHEST SEX RATIOS |
|
| Wacol | Greater Brisbane | 241.2 |
| Tablelands | Rest of Qld | 151.9 |
| Broadsound - Nebo | Rest of Qld | 133.5 |
| Glenlee - Rockyview | Rest of Qld | 133.4 |
| Mount Isa Region | Rest of Qld | 129.0 |
LOWEST SEX RATIOS |
|
| Millbank - Avoca | Rest of Qld | 86.5 |
| Buderim - North | Rest of Qld | 87.3 |
| Pialba - Eli Waters | Rest of Qld | 87.4 |
| Keperra | Greater Brisbane | 87.6 |
| Coombabah | Rest of Qld | 87.6 |
|
| (a) Excludes SA2s with a population of less than 1,000 at June 2017. |
AGE AND SEX DISTRIBUTION
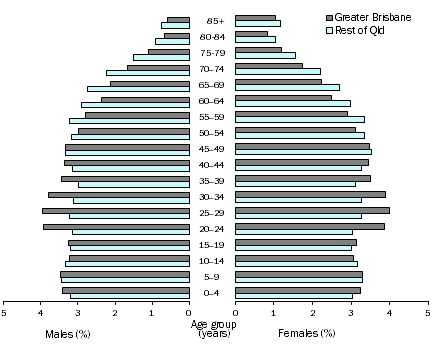
- At June 2017, Greater Brisbane had a higher proportion of its population aged 20 to 44 years (37%) than the rest of Queensland (32%).This reflects a pattern of young adults moving to capital cities to pursue work, education and other opportunities. In contrast, Greater Brisbane had a lower proportion aged 45 years and over (37%) than the rest of the state (43%).
AGE AND SEX DISTRIBUTION (%), Queensland - 30 June 2017

|
|
 Quality Declaration
  Print Page
 Print All