Contents >>
Impact on Income Distribution
IMPACT ON INCOME DISTRIBUTION
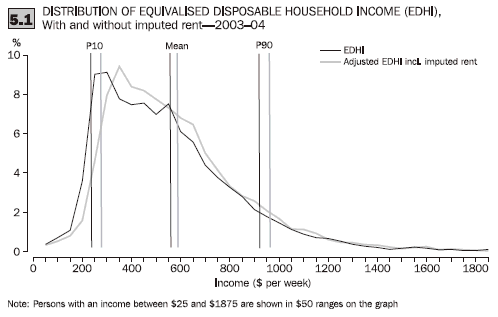
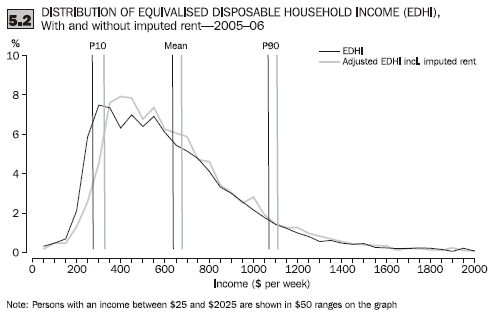
The addition of net imputed rent to disposable household income has a partial equalising effect on the distribution of household income. This result reflects that, for many home owners in lower income ranges the family home that they own is the largest asset held by the household, and the net imputed rent income from that asset is a relatively large proportion of the households' incomes. In higher income ranges the net imputed rent income is a relatively smaller proportion of the households' incomes. This equalising effect of accounting for net imputed rent in income analysis is illustrated in the following frequency distribution graphs, tables and discussion of a range of distribution measures.


Percentile ratios are one measure of the spread of incomes across the population. P90 (i.e. the income level separating the bottom 90% of the population from the top 10%) and P10 (i.e. dividing the bottom 10% of the population from the rest) are shown on the above graphs. In 2005-06, P90 for equivalised disposable household income was $1,073 per week and P10 was $274 per week, giving a P90/P10 ratio of 3.92. When net imputed rent was added to income the P90/P10 ratio fell to 3.43.
Table 5.3 includes a range of measures of the distribution of household income. These measures are discussed in Appendix 1 of Household and Income Distribution, Australia, 2005-06 (cat. no. 6523.0).
5.3 Equivalised disposable household income distribution, 2003-04 and 2005-06 |
|  |
 |  |  | 2003-04 | 2005-06 |  |
| Indicator |  | Equivalised
disposable
household
income | Adjusted
equivalised
disposable
household
income, incl.
imputed rent | Equivalised
disposable
household
income | Adjusted
equivalised
disposable
household
income, incl.
imputed rent |  |
|  |
| Mean income per week |  |  |  |  |  |  |
 | Lowest quintile | $ | 226 | 267 | 255 | 298 |  |
 | Second quintile | $ | 360 | 401 | 414 | 454 |  |
 | Third quintile | $ | 493 | 525 | 565 | 597 |  |
 | Fourth quintile | $ | 645 | 675 | 746 | 774 |  |
 | Highest quintile | $ | 1 041 | 1 082 | 1 239 | 1 287 |  |
 | All persons | $ | 553 | 590 | 644 | 682 |  |
 | Second and third deciles | $ | 300 | 344 | 341 | 389 |  |
| Median income per week | $ | 494 | 525 | 563 | 594 |  |
| Income per week at top of selected percentiles |  |  |  |  |  |  |
 | 10th (P10) | $ | 246 | 286 | 274 | 324 |  |
 | 20th (P20) | $ | 299 | 345 | 340 | 387 |  |
 | 30th (P30) | $ | 358 | 401 | 414 | 454 |  |
 | 40th (P40) | $ | 425 | 460 | 489 | 523 |  |
 | 50th (P50) | $ | 494 | 525 | 563 | 594 |  |
 | 60th (P60) | $ | 562 | 594 | 647 | 676 |  |
 | 70th (P70) | $ | 641 | 669 | 743 | 770 |  |
 | 80th (P80) | $ | 747 | 778 | 867 | 897 |  |
 | 90th (P90) | $ | 922 | 958 | 1 073 | 1 111 |  |
| Income share |  |  |  |  |  |  |
 | Lowest quintile | % | 8.2 | 9.0 | 7.9 | 8.7 |  |
 | Second quintile | % | 13.0 | 13.6 | 12.9 | 13.3 |  |
 | Third quintile | % | 17.8 | 17.8 | 17.6 | 17.5 |  |
 | Fourth quintile | % | 23.3 | 22.9 | 23.2 | 22.7 |  |
 | Highest quintile | % | 37.6 | 36.7 | 38.5 | 37.7 |  |
 | All persons | % | 100.0 | 100.0 | 100.0 | 100.0 |  |
 | Second and third deciles | % | 10.8 | 11.7 | 10.6 | 11.4 |  |
| Ratio of income at top of selected income percentiles |  |  |  |  |  |  |
 | P90/P10 | ratio | 3.75 | 3.35 | 3.92 | 3.43 |  |
 | P80/P20 | ratio | 2.50 | 2.25 | 2.55 | 2.32 |  |
 | P80/P50 | ratio | 1.51 | 1.48 | 1.54 | 1.51 |  |
 | P20/P50 | ratio | 0.61 | 0.66 | 0.60 | 0.65 |  |
| Gini coefficient | no. | 0.297 | 0.277 | 0.307 | 0.290 |  |
| Number of households in sample | no. | 11 361 | 11 361 | 9 961 | 9 961 |  |
|  |
The Gini coefficient is a measure of the degree of income inequality across the population. The Gini coefficient is a single statistic that lies between 0 and 1, with values closer to 0 representing a lesser degree of inequality, and values closer to 1 representing greater inequality.
The addition of net imputed rent saw a decrease in the Gini coefficient in both years, again indicating that the inclusion of net imputed rent in income results in a more equal distribution. For 2005-06, the Gini coefficient was 0.307 without net imputed rent, declining by 5.5% to 0.290 when net imputed rent was included in income. In 2003-04, the decrease in the Gini coefficient was 6.7%.
The importance of net imputed rent at the lower end of the income distribution can be seen when looking at changes in the income shares going to groups of people at different points in the distribution. In both years, when net imputed rent is added to income, the share of income for those in the lowest two quintiles increases as does the income share for those in the 'low income' group (i.e. the 20% of the population in the 2nd and 3rd income deciles). In comparison, the share of income in the top two income quintiles decreases, while the income share of those in the middle income quintile remains steady.
Table 5.4 indicates the extent to which the income ranking of individuals changes as a result of adding net imputed rent. Quintiles based on equivalised disposable household income (EDHI) are compared against quintiles based on adjusted equivalised disposable household income including imputed rent.
5.4 Comparison of income quintiles, with and without imputed rent, 2003-04 and 2005-06 |
|
 |  | Equivalised disposable household income - quintile |
| ADJUSTED EDHI, INCL. IMPUTED RENT - QUINTILE |  | Lowest | Second | Third | Fourth | Highest | All persons |
2003-04 |
|
| Lowest | % | 16.0 | 3.9 | *0.1 | - | - | 20.0 |
| Second | % | 3.8 | 12.8 | 3.3 | *0.1 | - | 20.0 |
| Third | % | 0.2 | 3.1 | 13.6 | 3.0 | **0.1 | 20.0 |
| Fourth | % | - | 0.1 | 3.0 | 15.0 | 1.8 | 20.0 |
| Highest | % | - | - | - | 1.8 | 18.1 | 20.0 |
| All persons | % | 20.0 | 20.0 | 20.0 | 20.0 | 20.0 | 100.0 |
2005-06 |
|
| Lowest | % | 15.6 | 4.2 | *0.1 | - | - | 20.0 |
| Second | % | 4.2 | 12.3 | 3.5 | - | - | 20.0 |
| Third | % | 0.2 | 3.3 | 13.5 | 3.0 | - | 20.0 |
| Fourth | % | - | *0.1 | 2.8 | 15.0 | 1.9 | 20.0 |
| Highest | % | - | - | **0.1 | 1.9 | 18.0 | 20.0 |
| All persons | % | 20.0 | 20.0 | 20.0 | 20.0 | 20.0 | 100.0 |
|
| * estimate has a relative standard error of 25% to 50% and should be used with caution |
| ** estimate has a relative standard error greater than 50% and is considered too unreliable for general use |
| - nil or rounded to zero (including null cells) |
In total, about one quarter of people (24% of persons in 2003-04 and 26% in 2005-06) move between income quintiles when imputed rent is added to income. The biggest movement is seen in the second and third income quintiles. For example, in 2005-06, 3.4% of people moved from the second quintile to a higher quintile when net imputed rent was added to income and all persons re-ranked, and 4.2% moved from the second quintile to the lowest quintile. The smallest movement was seen in the highest income quintile, where only 2% of persons in both 2003-04 and 2005-06 moved to a lower income quintile.
LOW INCOME HOUSEHOLDS
The ABS practice of using the second and third income decile as one measure when describing the characteristics of low income households is based on analyses of their net wealth and expenditure levels that indicate that many of the households included in the lowest income decile are unlikely to be suffering extremely low levels of economic wellbeing.
In 2005-06, of the people in the lowest equivalised disposable household income decile, 22% move to the second decile, 8% move to the third decile, 2% to the fourth decile and 1% to the fifth decile after adjusting for imputed rent and re-ranking.
This large movement of people re-ranked out of the lowest income decile results in a significant change in the characteristics of households in the re-ranked lowest income decile. For example:
- the mean age of the household reference person drops from 58 to 49 years;
- mean net worth falls from $353,000 to $245,000;
- the proportion of households that own their home without a mortgage drops from 46% to 20%; and
- the proportion of renters increases from 37% to 54%.
The movements in 2003-04 are similar, and analysis of 2003-04 HES data shows that expenditure in the lowest decile falls significantly after re-ranking based on income adjusted to include imputed rent.
 Print Page
 Print All