1367.0 - State and Territory Statistical Indicators, 2012  
ARCHIVED ISSUE Released at 11:30 AM (CANBERRA TIME) 12/06/2012  Final
   Page tools: Print Print Page Print all pages in this productPrint All


Graph Image for Unemployment Rate - Trend - ACT

Graph Image for CPI - Annual Change, Canberra

Graph Image for Dwelling Approvals (No.) ACT

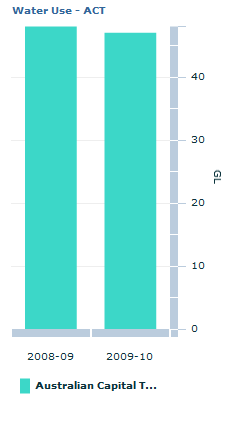
Graph Image for Water Use - ACT
Link to Australian Capital Territory People page Link to Australian Capital Territory Economy page Link to Australian Capital Territory Industry page Link to Australian Capital Territory Environment and Energy page
Demography
Work
Education and Training
Health
Family and Community
Crime
State Accounts
Prices
Investment and Finance
International Trade
Agriculture
Construction
Retail
Tourism
Water
Energy
Greenhouse Gases