4524.0 - In Focus: Crime and Justice Statistics, June 2013
ARCHIVED ISSUE Released at 11:30 AM (CANBERRA TIME) 19/06/2013
Page tools:
 Print Page Print Page
 Print All Print All
| ||||||||||||||||||||||||||||||||||||||||||||||||||||||||||||||||||||||||||||||||
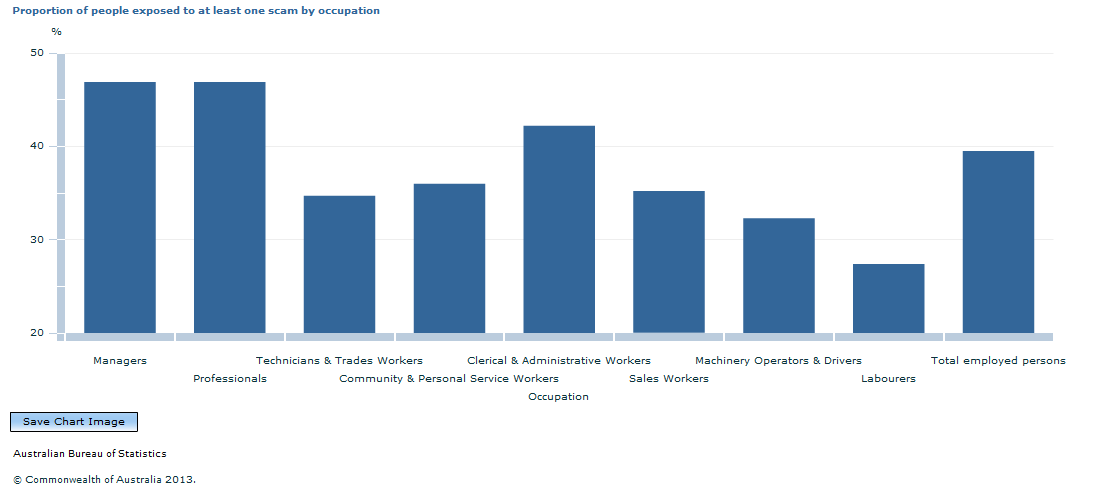
Employed people were more likely to be exposed to a scam than unemployed people (39.5% compared to 34.5%), whilst both employed and unemployed people were more likely to be exposed than people not in the labour force (28.4%). Employed people were more likely to be a victim of a scam than people not in the labour force (3.2% compared to 2.1%). Employed victims of scams were more likely to report the incident to an authority than victims that were unemployed or not in the labour force (33.5% compared to 25.1%). Around one in five scam victims that were employed (20.5%) reported the incident to a business, which was larger than the proportion of victims that were unemployed or not in the labour force that reported the incident to a business (11.3%). The proportion of individuals exposed to a scam varied across the different occupation categories, with managers (46.9%), professionals (46.9%), and clerical and administrative workers (42.2%) all more likely to be exposed to at least one scam, whilst technicians and trades workers (34.7%), community and personal service workers (36.0%), sales workers (35.2%), machinery operators and drivers (32.3%), and labourers (27.4%) were all less likely to be exposed to at least one scam relative to the employed population as a whole.  Source(s): In Focus: Crime and Justice Statistics In terms of specific scams, people employed as managers and professionals were more likely to be exposed to the all of the scams presented in Table 1, whilst people employed as technicians and trades workers, machinery operators and drivers, and labourers were all less likely to be exposed. Machinery operators and drivers were also more likely to respond to a scam offer than the employed population as a whole (13.2% compared to 8.2%). Table 1 - PROPORTION OF PEOPLE EXPOSED TO SELECTED SCAMS BY OCCUPATION TYPE
|
||||||||||||||||||||||||||||||||||||||||||||||||||||||||||||||||||||||||||||||||
