 PUBLIC TRANSPORT
In October 2009, usual residents aged 18 years and over in the Brisbane Major Statistical Region (hereafter referred to as Brisbane) were surveyed to find out if they had used public transport in the month prior to the survey. If they had used it, they were asked how often they usually used it and their main reason for doing so. If they had not used public transport in the month prior to the survey, they were asked their main reason for not using it.
Use of public transport in Brisbane
In October 2009 in Brisbane, 509,500 usual residents aged 18 years and over used public transport in the month prior to being surveyed. This represented 35% of Brisbane's 1,458,500 usual residents aged 18 years and over. There were 941,500 Brisbane adults (65%) who did not use public transport in the month prior to being surveyed.
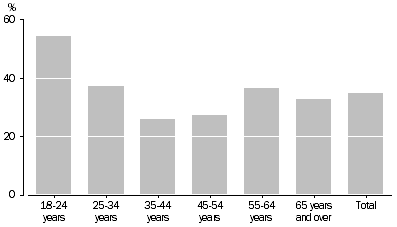
Use varied across age groups, persons aged 18 to 24 years were most likely to use public transport, with 54% (113,700) of total persons in this age group using it. Of the 202,500 persons aged 65 years and over, about one in three (33% or 66,100) used public transport in the month prior to being surveyed (table 5.1).
Proportion of persons using public transport, Age groups
: Brisbane
- Oct. 2009
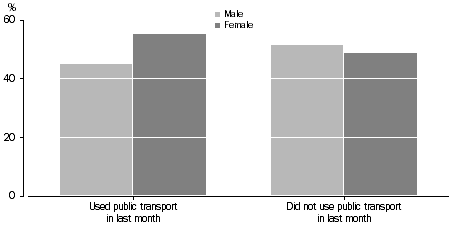
Of the 509,500 Brisbane adults that used public transport, 55% (280,800) were women and 45% (228,600) were men. Of the 941,500 Brisbane adults who did not use public transport, 49% (457,900) were women and 51% (483,500) were men (table 5.2).
Proportion of persons using or not using public transport, Sex of person
: Brisbane
- Oct. 2009
Use of public transport in Brisbane Labour Force Regions
For a map of the Brisbane Labour Force Regions, refer to Labour Force Region Map - Queensland_inset.
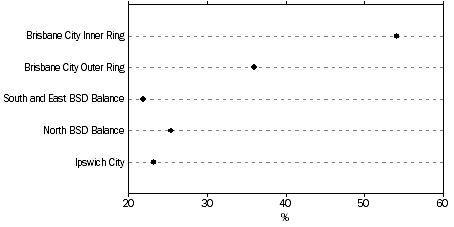
There were 354,300 persons aged 18 years and over in the Brisbane City Inner Ring, of which 54% (191,800) used public transport in the month prior to being surveyed. Of the 464,100 persons aged 18 years and over in the Brisbane City Outer Ring, 36% (167,200) used public transport in the same period. For the remaining regions, 25% (63,600) of adults who usually resided in the North Brisbane Statistical Division (BSD) Balance used public transport, 23% (28,400) of those in Ipswich City used it and 22% (58,500) of those in the South and East BSD Balance used it (table 5.3).
Proportion of persons using public transport, Brisbane Labour Force Regions
- Oct. 2009
Main reason for using public transport
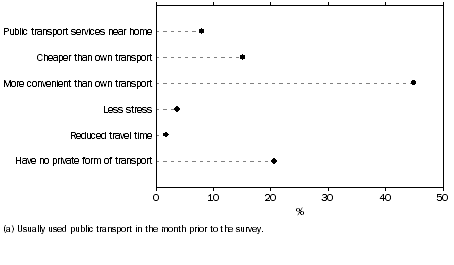
Of the 509,500 persons in Brisbane who used public transport in the month prior to being surveyed October 2009, the most common main reason for using it was that public transport was more convenient than their own transport (45% or 228,900).
For a further 21% (104,500), the main reason was that they had no private form of transport, and 15% (76,800) reported the main reason as being cheaper than their own transport.
Proportion of persons, Main reason for using public transport(a)
: Brisbane
- Oct. 2009
The most common main reason for using public transport reported by both males and females was that it was more convenient than their own transport (males 50% or 114,300 and females 41% or 114,500). Having no private form of transport was reported as the main reason by 20% of males (44,500) and 21% (60,000) of females (table 5.4). This was also the most common reason reported by all the age groups. For the youngest age group, 18 to 24 years, over one quarter (27% or 31,100) reported the main reason for using public transport was they had no private form of transport (table 5.5).
Main reason public transport was not used
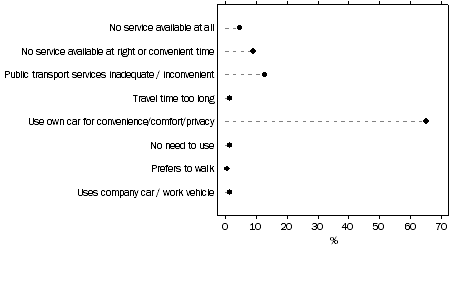
Of the 941,500 persons in Brisbane who had not used public transport in the month prior to the survey, the most common main reason for not using it was that they used their own car for convenience/comfort/privacy (65% or 612,000) (table 5.6).
The next two most common main reasons reported were inadequate/inconvenient public transport services (13% or 121,100) and no service available at right/convenient time (9% or 86,700).
Proportion of persons, Main reason for not using public transport
: Brisbane
- Oct. 2009
Frequency of public transport use
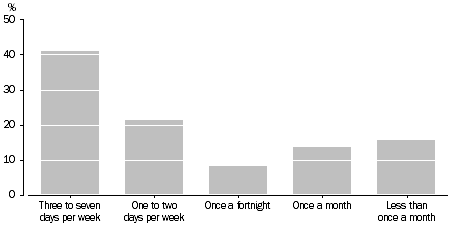
In October 2009, of the 509,500 persons in Brisbane who used public transport, 41% (208,900) usually used it between three and seven days a week, 21% (108,900) used it one to two days a week and 16% (80,200) used it less than once a month (table 5.8).
Proportion of persons usually using public transport, Frequency of use
: Brisbane
- Oct. 2009
5.1 WHETHER PUBLIC TRANSPORT USED, Age groups: Brisbane(a) - Oct. 2009 |
|
 | | Used public transport in last month | Did not use public transport in last month | Total(b) |
|
| Number ('000) | | | |
| 18-24 years | 113.7 | 92.9 | 209.2 |
| 25-34 years | 108.8 | 179.6 | 292.5 |
| 35-44 years | 74.4 | 213.9 | 288.2 |
| 45-54 years | 70.1 | 186.7 | 256.7 |
| 55-64 years | 76.4 | 133.0 | 209.4 |
| 65 years and over | 66.1 | 135.5 | 202.5 |
| Total | 509.5 | 941.5 | 1 458.5 |
| Proportion (%) | | | |
| 18-24 years | 54.4 | 44.4 | 100.0 |
| 25-34 years | 37.2 | 61.4 | 100.0 |
| 35-44 years | 25.8 | 74.2 | 100.0 |
| 45-54 years | 27.3 | 72.7 | 100.0 |
| 55-64 years | 36.5 | 63.5 | 100.0 |
| 65 years and over | 32.7 | 66.9 | 100.0 |
| Total | 34.9 | 64.5 | 100.0 |
|
| (a) Refers to the Brisbane Major Statistical Region. |
| (b) Includes persons who did not know whether public transport was used in last month. |
5.2 SEX OF PERSONS AGED 18 YEARS AND OVER, Whether public transport used: Brisbane(a) - Oct. 2009 |
|
| | Male | Female | Total |
|
| Number ('000) | | | |
| Used public transport in last month | 228.6 | 280.8 | 509.5 |
| Did not use public transport in last month | 483.5 | 457.9 | 941.5 |
| Total(b) | 714.0 | 744.5 | 1 458.5 |
| Proportion (%) | | | |
| Used public transport in last month | 44.9 | 55.1 | 100.0 |
| Did not use public transport in last month | 51.4 | 48.6 | 100.0 |
| Total(b) | 49.0 | 51.0 | 100.0 |
|
| (a) Refers to the Brisbane Major Statistical Region. |
| (b) Includes persons whose public transport use was not known. |
5.3 WHETHER PUBLIC TRANSPORT USED, Persons aged 18 years and over - Labour force regions: Brisbane(a) - Oct. 2009 |
|
| | Used public transport
in last month | Did not use public transport
in last month | Total(b) |
|
| Number ('000) | | | |
| Brisbane City Inner Ring Statistical Region | 191.8 | 158.4 | 354.3 |
| Brisbane City Outer Ring Statistical Region | 167.2 | 295.1 | 464.1 |
| South and East BSD Balance Statistical Region | 58.5 | 207.1 | 267.2 |
| North BSD Balance Statistical Region | 63.6 | 186.6 | 250.1 |
| Ipswich City Statistical Region | 28.4 | 94.3 | 122.8 |
| Total(a) | 509.5 | 941.5 | 1 458.5 |
| Proportion (%) | | | |
| Brisbane City Inner Ring Statistical Region | 54.1 | 44.7 | 100.0 |
| Brisbane City Outer Ring Statistical Region | 36.0 | 63.6 | 100.0 |
| South and East BSD Balance Statistical Region | 21.9 | 77.5 | 100.0 |
| North BSD Balance Statistical Region | 25.4 | 74.6 | 100.0 |
| Ipswich City Statistical Region | 23.2 | 76.8 | 100.0 |
| Total(a) | 34.9 | 64.5 | 100.0 |
|
| (a) Refers to the Brisbane Major Statistical Region. |
| (b) Includes persons who did not know whether public transport was used in last month. |
5.4 MAIN REASON PUBLIC TRANSPORT USED, Sex of persons aged 18 years and over: Brisbane(a) - Oct. 2009 |
|
| | Public transport
services
near home | Cheaper than
own transport | More convenient
than own transport | Less
stress | Reduced
travel time | Have no
private form
of transport | Total(b) |
|
| Number ('000) | | | | | | | |
| Male | 14.0 | 27.7 | 114.3 | *10.1 | *5.3 | 44.5 | 228.6 |
| Female | 26.6 | 49.1 | 114.5 | *8.7 | **3.7 | 60.0 | 280.8 |
| Total | 40.6 | 76.8 | 228.9 | 18.8 | *9.0 | 104.5 | 509.5 |
| Proportion (%) | | | | | | | |
| Male | 6.1 | 12.1 | 50.0 | *4.4 | *2.3 | 19.5 | 100.0 |
| Female | 9.5 | 17.5 | 40.8 | *3.1 | **1.3 | 21.4 | 100.0 |
| Total | 8.0 | 15.1 | 44.9 | *3.7 | *1.8 | 20.5 | 100.0 |
|
| * estimate has a relative standard error of 25% to 50% and should be used with caution |
| ** estimate has a relative standard error greater than 50% and is considered too unreliable for general use |
| (a) Refers to the Brisbane Major Statistical Region. |
| (b) Includes main reason 'other' and persons who did not know why public transport was used in last month. |
5.5 MAIN REASON PUBLIC TRANSPORT USED, Age groups: Brisbane(a) - Oct. 2009 |
|
| | Public transport
services near home | Cheaper than
own transport | More convenient
than own
transport | Less stress | Reduced
travel time | Have no
private form
of transport | Total(b) |
|
| Number ('000) | | | | | | | |
| 18-24 years | *11.1 | *14.0 | 49.1 | np | np | 31.1 | 113.7 |
| 25-54 years | 21.0 | 39.0 | 115.3 | *8.2 | *5.8 | 47.5 | 253.2 |
| 55 years and over | *8.5 | 23.8 | 64.4 | np | np | 26.0 | 142.5 |
| Total | 40.6 | 76.8 | 228.9 | 18.8 | *9.0 | 104.5 | 509.5 |
| Proportion (%) | | | | | | | |
| 18-24 years | *9.8 | *12.3 | 43.2 | np | np | 27.3 | 100.0 |
| 25-54 years | 8.3 | 15.4 | 45.5 | *3.2 | *2.3 | 18.7 | 100.0 |
| 55 years and over | *6.0 | 16.7 | 45.2 | np | np | 18.3 | 100.0 |
| Total | 8.0 | 15.1 | 44.9 | *3.7 | *1.8 | 20.5 | 100.0 |
|
| * estimate has a relative standard error of 25% to 50% and should be used with caution |
| np not available for publication but included in totals where applicable, unless otherwise indicated |
| (a) Refers to the Brisbane Major Statistical Region. |
| (b) Includes main reason 'other' and persons who did not know why public transport was used in last month. |
5.6 MAIN REASON PUBLIC TRANSPORT NOT USED, Sex of persons aged 18 years and over: Brisbane(a) - Oct. 2009 |
|
| | No service available at all | No service
available
at right or
convenient time | Public transport
services
inadequate/ inconvenient | Travel time
too long | Use own
car for
convenience/
comfort/
privacy | No need
to use | Prefers to walk | Uses company car/work vehicle | Total(b) |
|
| Number ('000) | | | | | | | | | |
| Male | 26.1 | 45.6 | 54.6 | *5.6 | 315.6 | *7.4 | *4.1 | *10.5 | 483.5 |
| Female | *17.9 | 41.0 | 66.5 | *9.9 | 296.4 | *7.3 | *3.1 | **3.5 | 457.9 |
| Total | *44.0 | 86.7 | 121.1 | *15.5 | 612.0 | *14.7 | *7.2 | *14.0 | 941.5 |
| Proportion (%) | | | | | | | | | |
| Male | 5.4 | 9.4 | 11.3 | *1.1 | 65.3 | *1.5 | *0.8 | *2.2 | 100.0 |
| Female | *3.9 | 9.0 | 14.5 | *2.2 | 64.7 | *1.6 | *0.7 | **0.8 | 100.0 |
| Total | 4.7 | 9.2 | 12.9 | *1.6 | 65.0 | *1.6 | *0.8 | *1.5 | 100.0 |
|
| * estimate has a relative standard error of 25% to 50% and should be used with caution |
| ** estimate has a relative standard error greater than 50% and is considered too unreliable for general use |
| (a) Refers to the Brisbane Major Statistical Region. |
| (b) Includes main reason 'other' and persons who did not know why public transport was not used in last month. |
5.7 MAIN REASON PUBLIC TRANSPORT NOT USED, Age groups: Brisbane(a) - Oct. 2009 |
|
| | No service
available
at all | No service
available at
right or
convenient time | Public transport
services
inadequate/
inconvenient | Travel time
too long | Use own car
for convenience/
comfort/
privacy | No need
to use | Prefers to walk
(Qld data only) | Uses
company
car/work
vehicle | Total(b) |
|
| Number ('000) | | | | | | | | | |
| 18-24 years | **4.8 | *8.1 | *9.8 | np | 66.4 | — | np | np | 92.9 |
| 25-54 years | *25.8 | 59.3 | 68.8 | *10.7 | 372.6 | *11.9 | *4.7 | *13.0 | 580.1 |
| 55 years and over | *13.4 | 19.2 | 42.5 | np | 173.0 | **2.8 | np | np | 268.5 |
| Total | *44.0 | 86.7 | 121.1 | *15.5 | 612.0 | *14.7 | *7.2 | *14.0 | 941.5 |
| Proportion (%) | | | | | | | | | |
| 18-24 years | **5.1 | *8.8 | *10.5 | np | 71.5 | — | np | np | 100.0 |
| 25-54 years | *4.5 | 10.2 | 11.9 | *1.8 | 64.2 | *2.1 | *0.8 | *2.2 | 100.0 |
| 55 years and over | *5.0 | 7.2 | 15.8 | np | 64.4 | **1.0 | np | np | 100.0 |
| Total | 4.7 | 9.2 | 12.9 | *1.6 | 65.0 | *1.6 | *0.8 | *1.5 | 100.0 |
|
| * estimate has a relative standard error of 25% to 50% and should be used with caution |
| ** estimate has a relative standard error greater than 50% and is considered too unreliable for general use |
| — nil or rounded to zero (including null cells) |
| np not available for publication but included in totals where applicable, unless otherwise indicated |
| (a) Refers to the Brisbane Major Statistical Region. |
| (b) Includes main reason 'other' and persons who did not know why public transport was not used in last month. |
5.8 FREQUENCY OF USUAL PUBLIC TRANSPORT USE, Persons aged 18 years and over: Brisbane(a) - Oct. 2009 |
|
| Three to seven days
a week | One to two days
a week | Once a fortnight | Once a month | Less than once
a month | Total(b) |
|
| Number ('000) | 208.9 | 108.9 | 41.0 | 69.5 | 80.2 | 509.5 |
| Proportion (%) | 41.0 | 21.4 | 8.1 | 13.6 | 15.7 | 100.0 |
|
| (a) Refers to the Brisbane Major Statistical Region. |
| (b) Includes frequency of use not known. |
 Quality Declaration
  Print Page
 Print All