 WATER AND ENERGY SOURCES
The majority of households were connected to mains water and electricity. There were also a substantial number of households receiving their water and energy from multiple sources.
Water sources
All sources of water used at dwelling
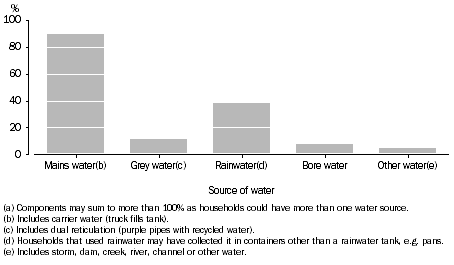
In October 2009, nine out of ten Queensland households (90% or 1,485,300) used mains water as a source of water at their dwelling. Households can have multiple water sources. Rainwater was used by 38% (635,100) of households. Grey water was used by 12% (191,000), bore water by 8% (124,400) and 5% (81,900) used water from other sources.
Proportion of households(a), Household water sources
: Qld
- Oct. 2009
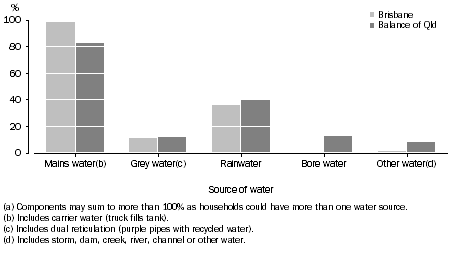
In October 2009, mains water was the most common source of water used by households (99% or 721,200) in the Brisbane Major Statistical Region (hereafter referred to as Brisbane). Mains water was also the most common source of water for the Balance of Queensland, being used by 83% (764,200) of households. The proportions of households using rainwater, bore water, grey water and other water sources were all greater for households in the Balance of Queensland than for Brisbane households (table 1.1).
Proportion of households(a), Household water sources
: Brisbane & Balance of Qld
- Oct. 2009
Rainwater tanks
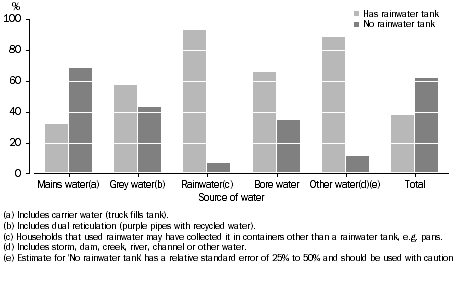
There were 628,900 households in Queensland in October 2009 with a rainwater tank at their dwelling. This represented 38% of all households in Queensland.
Of the 1,485,300 Queensland households in October 2009 that used mains water as a source of water for their dwelling, 32% (470,800) also had a rainwater tank at their dwelling (table 1.2).
Proportion of households, Household water sources
- Whether has a rainwater tank
: Qld
- Oct. 2009
Energy sources
All sources of energy used at dwelling
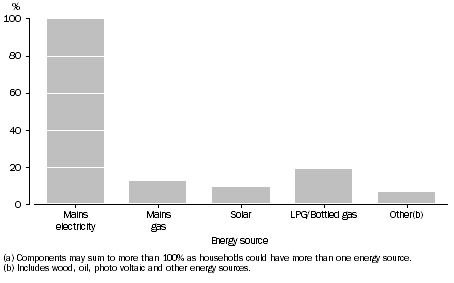
Almost all Queensland households (99.9% or 1,652,600) used mains electricity at their dwelling in October 2009. Households can use multiple energy sources. Other sources of energy used were: Liquid Petroleum Gas (LPG)/bottled gas 19% (316,500), mains gas 12% (203,900), and solar energy, which was used in 10% (157,600) of households.
Proportion of households(a), Household sources of energy
: Qld
- Oct. 2009
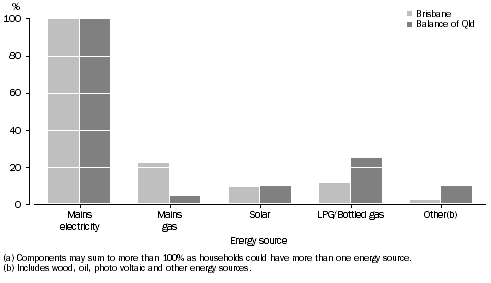
When comparing Brisbane with the Balance of Queensland, there was little difference in the proportion of households using mains electricity at their dwelling and in the proportion of households using solar energy at their dwelling. However, there was a noticeable difference between Brisbane and Balance of Queensland in the proportions of households using mains gas and the proportion using LPG/bottled gas. There were 22% (163,500) of households using mains gas in Brisbane compared with only 4% (40,400) in the Balance of Queensland. LPG/bottled gas was used by 12% (85,200) of households in Brisbane compared with 25% (231,300) in the Balance of Queensland (table 1.3).
Proportion of households(a), Household sources of energy
: Brisbane and Balance of Qld
- Oct. 2009
1.1 ALL SOURCES OF HOUSEHOLD WATER: Qld - Oct. 2009 |
|
 |  | Mains water(a) | Grey water(b) | Rainwater(c) | Bore water | Other
water(d) | Total
households(e) |
|
| Number ('000) |  |  |  |  |  |  |
 | Brisbane(f) | 721.2 | 79.9 | 259.6 | *4.7 | 8.0 | 730.9 |
 | Balance of Qld | 764.2 | 111.1 | 375.5 | 119.7 | 73.9 | 923.2 |
 | Total | 1 485.3 | 191.0 | 635.1 | 124.4 | 81.9 | 1 654.0 |
| Proportion (%) |  |  |  |  |  |  |
 | Brisbane(f) | 98.7 | 10.9 | 35.5 | *0.6 | 1.1 | 100.0 |
 | Balance of Qld | 82.8 | 12.0 | 40.7 | 13.0 | 8.0 | 100.0 |
 | Total | 89.8 | 11.5 | 38.4 | 7.5 | 4.9 | 100.0 |
|
| * estimate has a relative standard error of 25% to 50% and should be used with caution |
| (a) Includes carrier water (truck fills tank). |
| (b) Includes dual reticulation (purple pipes with recycled water). |
| (c) Households that used rainwater may have collected it in containers other than a rainwater tank, e.g. pans. |
| (d) Includes storm, dam, creek, river, channel or other water. |
| (e) Components may sum to more than total as households may have more than one water source. |
| (f) Refers to the Brisbane Major Statistical Region. |
1.2 WHETHER DWELLING HAS A RAINWATER TANK, All sources of household water: Qld - Oct. 2009 |
|
 |  | Has rainwater tank | No rainwater tank | Total |
|
| Number ('000) |  |  |  |
 | Mains water(a) | 470.8 | 1 014.6 | 1 485.3 |
 | Grey water(b) | 108.8 | 82.2 | 191.0 |
 | Rainwater(c) | 591.8 | 43.3 | 635.1 |
 | Bore water | 81.5 | 42.9 | 124.4 |
 | Other water(d) | 72.4 | 9.5 | 81.9 |
 | Total households(e) | 628.9 | 1 025.1 | 1 654.0 |
| Proportion (%) |  |  |  |
 | Mains water(a) | 31.7 | 68.3 | 100.0 |
 | Grey water(b) | 57.0 | 43.0 | 100.0 |
 | Rainwater(c) | 93.2 | 6.8 | 100.0 |
 | Bore water | 65.5 | 34.5 | 100.0 |
 | Other water(d) | 88.5 | *11.5 | 100.0 |
 | Total households(e) | 38.0 | 62.0 | 100.0 |
|
| * estimate has a relative standard error of 25% to 50% and should be used with caution |
| (a) Includes carrier water (truck fills tank). |
| (b) Includes dual reticulation (purple pipes with recycled water). |
| (c) Households that used rainwater may have collected it in containers other than a rainwater tank, e.g. pans. |
| (d) Includes storm, dam, creek, river, channel or other water. |
| (e) Components may sum to more than total as households may have more than one water source. |
1.3 ALL SOURCES OF HOUSEHOLD ENERGY: Brisbane & Balance of Qld - Oct. 2009 |
|
 |  | Mains electricity | Mains gas | Solar | LPG/
Bottled gas | Other(a) | Total
households(b) |
|
| Number ('000) |  |  |  |  |  |  |
 | Brisbane(c) | 730.9 | 163.5 | 67.3 | 85.2 | 17.3 | 730.9 |
 | Balance of Qld | 921.8 | 40.4 | 90.3 | 231.3 | 93.5 | 923.2 |
 | Total | 1 652.6 | 203.9 | 157.6 | 316.5 | 110.8 | 1 654.0 |
| Proportion (%) |  |  |  |  |  |  |
 | Brisbane(c) | 100.0 | 22.4 | 9.2 | 11.7 | 2.4 | 100.0 |
 | Balance of Qld | 99.8 | 4.4 | 9.8 | 25.0 | 10.1 | 100.0 |
 | Total | 99.9 | 12.3 | 9.5 | 19.1 | 6.7 | 100.0 |
|
| (a) Includes wood, oil, photo voltaic and other energy sources. |
| (b) Components may sum to more than total as households may have more than one energy source. |
| (c) Refers to the Brisbane Major Statistical Region. |
 Quality Declaration
  Print Page
 Print All