UNEMPLOYMENT
The 2006 Census unemployment rate (the number of people unemployed expressed as a proportion of the total labour force) for Indigenous people was 16% compared with 20% in 2001. About 71% of unemployed Indigenous people were looking for full-time work.
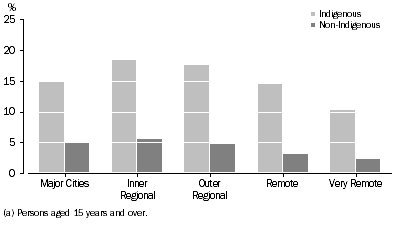
Indigenous people in the labour force were three times more likely than non-Indigenous people to be unemployed (16% compared with 5%).
Indigenous people living in Inner Regional and Outer Regional areas had the highest unemployment rates (both 18%). The lower Indigenous unemployment rate in Very Remote areas (10%) should be considered in conjunction with lower levels of labour force participation, limited labour market opportunities and participation in CDEP (for more information on CDEP participation see relevant section in this chapter).
unemployment rates(a) by remoteness areas

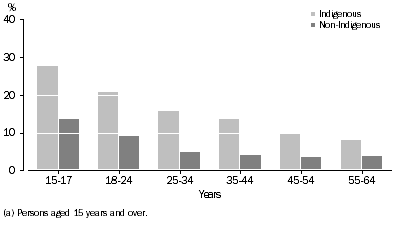
Indigenous men and women had similar unemployment rates (16% and 15% respectively), as did non-Indigenous men and women (both 5%). Compared with the overall Indigenous unemployment rate, the younger age groups had higher unemployment rates (28% unemployment rate for 15-17 years and 21% for 18-24 years). A similar pattern was observed in the non-Indigenous population, where the unemployment rate for the 15-17 and 18-24 year age groups was 13% and 9% respectively. The unemployment rate for both Indigenous and non-Indigenous people was progressively lower in other age groups up to 54 years.
unemployment rates(a), by Age Group

 Print Page
 Print All