COMPARISON BETWEEN VALUE ADDED BASED MFP AND GROSS OUTPUT BASED MFP
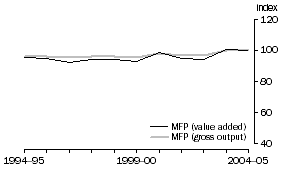
Table 2.14 presents a comparison between gross output based MFP growth and value added based MFP growth. The conceptual differences between the two sets of estimates are discussed in Chapter 1. The table shows gross output based MFP growth tends to be flatter, which is to be expected because of the relationship between value added and gross output.
2.14 Compound annual percentage change in gross output and value added based MFP, Market sector industries |
|  |
 | MFP (value added) | MFP (gross output) |  |
 | 1994-95 to 1999-00 | 1999-00 to 2004-05 | 1994-95 to 2004-05 | 1994-95 to 1999-00 | 1999-00 to 2004-05 | 1994-95 to 2004-05 |  |
|  |
| Agriculture, forestry & fishing | 8.2 | 2.9 | 5.5 | 3.9 | 1.5 | 2.7 |  |
| Mining | 0.6 | -2.1 | -0.8 | 0.3 | -1.2 | -0.5 |  |
| Manufacturing | 0.9 | 0.9 | 0.9 | 0.4 | 0.3 | 0.3 |  |
| Electricity, gas & water | 1.4 | -2.6 | -0.6 | 0.9 | -1.4 | -0.3 |  |
| Construction | 2.5 | 1.3 | 1.9 | 0.7 | 0.5 | 0.6 |  |
| Wholesale trade | 3.1 | 1.9 | 2.5 | 1.4 | 0.8 | 1.1 |  |
| Retail trade | 2.3 | 1.2 | 1.7 | 1.1 | 0.6 | 0.8 |  |
| Accommodation, cafes & restaurants | 1.2 | 1.4 | 1.3 | 0.7 | 0.5 | 0.6 |  |
| Transport & storage | 2.1 | 2.2 | 2.2 | 0.8 | 1.1 | 1.0 |  |
| Communication services | 3.4 | 0.5 | 1.9 | 1.8 | 0.3 | 1.1 |  |
| Finance & insurance | 2.6 | -0.4 | 1.1 | 1.9 | -0.1 | 0.9 |  |
| Cultural & recreational services | -0.6 | 1.5 | 0.5 | -0.1 | 0.9 | 0.4 |  |
|  |
Figures 2.15 to 2.26 show the pattern of value added and gross output MFP growth across the various market sector industries is similar, although the magnitude of growth differs. This indicates that the analysis underlying the estimates, which is presented in the industry chapters, will be applicable to both sets of MFP estimates.
MFP for the market sector industries, (2004-05 = 100)
2.15 Agriculture, Forestry & Fishing

2.16 Mining
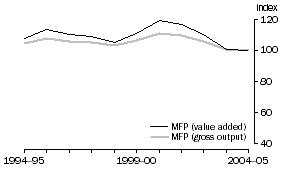 2.17 Manufacturing
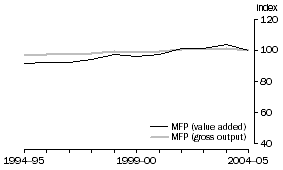 2.18 Electricity, gas & water
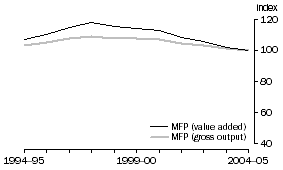 2.19 Construction
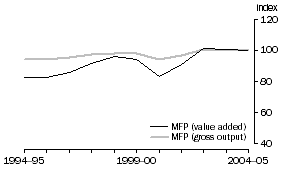 2.20 Wholesale trade
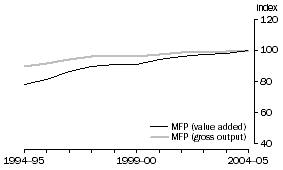 2.21 Retail trade
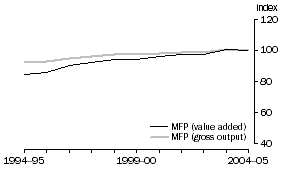 2.22 Accommodation, cafes & restaurants
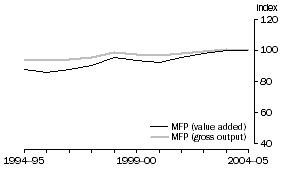 2.23 Transport & storage
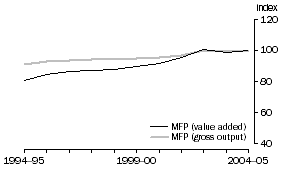 2.24 Communication services
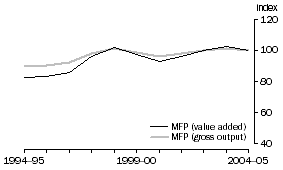 2.25 Finance & insurance
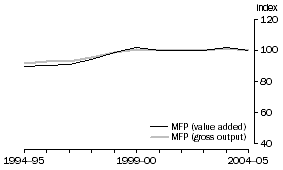 2.26 Cultural & recreational services
 Print Page
 Print All