STATE AND TERRITORY
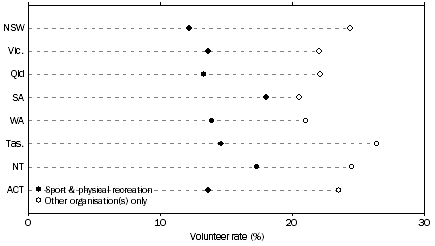
While the highest rates of volunteering for sport and physical recreation organisations were reported in South Australia (18%) and were lowest in New South Wales (12%), there was not enough evidence to show that there was a statistically significant difference in volunteering rates in different states and territories.
4.4 SPORT AND PHYSICAL RECREATION AND OTHER VOLUNTEERS, By state and territory

Volunteering was more common among those living in capital cities than in other parts of the state. The overall volunteer rate for capital cities was 22% compared with 14% for regions outside the capital cities. This was also the case for sport and physical recreation organisations, where the volunteer rate was 8% for capital cities compared with 5% outside capital cities. Tasmania was the only state or territory to have a higher volunteer rate in the balance of state (9%) than in the capital city (6%) for sport and physical recreation organisation volunteers.
4.5 Sport and Physical Recreation and Other Volunteers(a), By state and territory and capital city/balance of state |
|
 |  | Total sport & physical recreation organisation(s) | Other organisation(s) only | Total volunteers |
 |  | Capital city | Balance of state | Total | Capital city | Balance of state | Total | Capital city | Balance of state | Total |
|
| Volunteers ('000) |  |  |  |  |  |  |  |  |  |
 | New South Wales | 361.9 | 308.3 | 670.2 | 798.4 | 541.4 | 1 339.8 | 1 160.3 | 849.7 | 2 010.0 |
 | Victoria | 382.2 | 197.3 | 579.6 | 666.3 | 268.5 | 934.8 | 1 048.5 | 465.8 | 1 514.4 |
 | Queensland | 220.8 | 221.9 | 442.6 | 302.6 | 432.4 | 735.0 | 523.4 | 654.2 | 1 177.6 |
 | South Australia | 139.3 | 85.9 | 225.1 | 190.4 | 66.3 | 256.7 | 329.7 | 152.2 | 481.9 |
 | Western Australia | 167.4 | 68.3 | 235.6 | 279.1 | 75.9 | 354.9 | 446.4 | 144.1 | 590.5 |
 | Tasmania | 22.2 | 33.3 | 55.4 | 37.5 | 62.7 | 100.2 | 59.6 | 96.0 | 155.6 |
 | Northern Territory(b) | 17.1 | **5.0 | 22.1 | 26.1 | *5.2 | 31.3 | 43.1 | *10.2 | 53.3 |
 | Australian Capital Territory(c) | 37.1 | - | 37.1 | 63.8 | - | 63.8 | 100.9 | - | 100.9 |
 | Australia | 1 347.8 | 919.9 | 2 267.7 | 2 364.1 | 1 452.4 | 3 816.5 | 3 711.9 | 2 372.3 | 6 084.2 |
| Volunteer rate (%) |  |  |  |  |  |  |  |  |  |
 | New South Wales | 6.6 | 5.6 | 12.2 | 14.5 | 9.9 | 24.4 | 21.1 | 15.5 | 36.6 |
 | Victoria | 9.0 | 4.6 | 13.6 | 15.7 | 6.3 | 22.0 | 24.7 | 11.0 | 35.6 |
 | Queensland | 6.6 | 6.7 | 13.3 | 9.1 | 13.0 | 22.1 | 15.7 | 19.6 | 35.4 |
 | South Australia | 11.1 | 6.9 | 18.0 | 15.2 | 5.3 | 20.5 | 26.4 | 12.2 | 38.6 |
 | Western Australia | 9.9 | 4.0 | 13.9 | 16.5 | 4.5 | 21.0 | 26.4 | 8.5 | 34.9 |
 | Tasmania | 5.8 | 8.8 | 14.6 | 9.9 | 16.5 | 26.4 | 15.7 | 25.3 | 41.0 |
 | Northern Territory(b) | 13.4 | **3.9 | 17.3 | 20.4 | *4.1 | 24.5 | 33.8 | *8.0 | 41.8 |
 | Australian Capital Territory(c) | 13.6 | - | 13.6 | 23.5 | - | 23.5 | 37.1 | - | 37.1 |
 | Australia | 8.0 | 5.5 | 13.5 | 14.1 | 8.7 | 22.7 | 22.1 | 14.1 | 36.2 |
|
| * estimate has a relative standard error of 25% to 50% and should be used with caution |
| ** estimate has a relative standard error greater than 50% and is considered too unreliable for general use |
| - nil or rounded to zero (including null cells) |
| (a) Data on sport and physical recreation organisation(s) only and sport and physical recreation and other organisation(s) have been split in the spreadsheets. |
| (b) Refers to mainly urban areas only. See paragraph 8 of the Explanatory Notes in Voluntary Work, Australia, 2010 (cat. no. 4441.0). |
| (c) Australian Capital Territory refers to 'capital city' only. |
 Print Page
 Print All