CHAPTER 4 SPATIAL DISTRIBUTION OF DWELLING ACCESS TO THE INTERNET.
This chapter uses the detailed regional information available from the 2006 Census to look at variation in access to the Internet as well as Broadband between and within states and territories of Australia.
A range of thematic maps have been prepared, in different levels of detail, to facilitate the analysis. These are:
1. Percentage of occupied private dwellings with Internet connection by Statistical Division for Australia.
2. Percentage of occupied private dwellings with Broadband connection by Statistical Division for Australia.
3. Percentage of occupied private dwellings with Internet connection by Collection Districts for states and territories of Australia.
4. Percentage of occupied private dwellings with Broadband connection by Collection Districts for states and territories of Australia.
5. Percentage of occupied private dwellings with Internet connection by Statistical Local Areas for states and territories of Australia.
6. Percentage of occupied private dwellings with Broadband connection by Statistical Local Areas for states and territories of Australia.
7. Percentage of occupied private dwellings with Internet connection by Collection Districts by urban centres for state and territory capital cities of Australia.
8. Percentage of occupied private dwellings with Broadband connection by Collection Districts by urban centres for state and territory capital cities of Australia.
This chapter only includes a few selected maps. The remainder are available electronically from the Maps pdf on the Details Page of this product.
Reference areas (Statistical Divisions, Statistical Local Areas, or Collection Districts) have been ranked on the basis of access to the Internet (or Broadband) , and divided into five equal groups, or quintiles, with equal numbers of reference areas in each group. Reference areas plotted in red are in the top 20% of the reference areas in the map, while those plotted in pale yellow are in the bottom 20%. The state level maps have remoteness area boundaries superimposed. Similar maps depicting connectivity by selected ranges are available on request.
In addition to presenting thematic maps, summary tables of the ten SLAs with the highest percentages and lowest percentages of Broadband access are presented for capital cities and the rest of the states/territories (Tables 3 and 4). Further to the percentage of the population with Broadband and any Internet access, a number of key demographic variables are presented for each SLA. These demographic variables include age, personal income (per week), family composition, Indigenous status and language spoken at home. These detailed SLA tables for each State/territory are available on the ABS website. Each of these tables presented only includes Census respondents in occupied private dwellings that responded to the question on whether the dwelling has access to the Internet at home.
A small amount of SLAs have been excluded from these tables, where the population of these SLAs is too small to enable comparisons with the majority of SLAs in Australia. SLAs in capital cities have been excluded where the number of persons in the SLA is less than 400, whereas in other sections of the state/territory, SLAs have been excluded where the number of persons in the SLA is less than 200.
Table 3: SLA in the Capital Cities and Rest of the State/Territory of Australia, with the Highest Percentage of Persons with Access to Broadband-Highest 10 |
|  |
| | Nominal Population | % Any Internet | % BB connection | |
| | no. | % | % | |
| |
| Capital Cities | | | | |
| Fig Tree Pocket QLD | 3 079 | 94 | 79 | |
| Mount Ommaney QLD | 1 937 | 93 | 79 | |
| Ku-ring-gai (A) NSW | 94 030 | 91 | 78 | |
| Forrest ACT | 1 138 | 91 | 78 | |
| O'Malley ACT | 641 | 89 | 77 | |
| Peppermint Grove (S) WA | 1 312 | 89 | 77 | |
| Chapel Hill QLD | 9 578 | 93 | 77 | |
| Kenmore Hills QLD | 2 281 | 90 | 76 | |
| Melbourne (C) - S'bank-D'Lands VIC | 10 954 | 89 | 76 | |
| Brookfield (incl. Brisbane Forest Park) QLD | 4 053 | 93 | 76 | |
| Rest of the State/Territory | | | | |
| Nhulunbuy NT | 3 181 | 88 | 68 | |
| Roxby Downs (M) SA | 3 353 | 86 | 67 | |
| Murray QLD | 8 455 | 87 | 60 | |
| Douglas QLD | 4 568 | 85 | 60 | |
| Capel (S) - Pt A WA | 5 533 | 85 | 59 | |
| Roebourne (S) WA | 14 556 | 75 | 58 | |
| Pallarenda-Shelley Beach QLD | 855 | 84 | 57 | |
| Belyando (S) QLD | 9 434 | 79 | 57 | |
| Ashburton (S) WA | 5 706 | 73 | 56 | |
| Cairns (C) - Mt Whitfield QLD | 10 880 | 78 | 55 | |
| |
Table 4: SLA in the Capital Cities and Rest of the State/Territory of Australia, with the Lowest Percentage of Persons with Access to Broadband-Lowest 10 |
| |
| | Nominal Population | Any Internet | BB Connection | |
| | no. | % | % | |
| |
| Capital Cities | | | | |
| Ipswich (C) - South-West QLD | 3 934 | 64 | 7 | |
| Lee Point-Leanyer Swamp NT | 574 | 25 | 13 | |
| Litchfield (S) - Pt A NT | 1 057 | 47 | 15 | |
| Symonston ACT | 400 | 40 | 20 | |
| Litchfield (S) Pt B NT | 13 173 | 70 | 22 | |
| Winnellie NT | 468 | 37 | 24 | |
| Playford (C) - Elizabeth SA | 22 080 | 47 | 25 | |
| Derwent Valley (M) - Pt A TAS | 5 882 | 52 | 26 | |
| Port Adel. Enfield (C) - Park SA | 12 818 | 49 | 27 | |
| Coolangatta QLD | 5 724 | 43 | 29 | |
| Rest of the State/Territory | | | | |
| Injinoo (S) QLD | 390 | 2 | - | |
| Umagico (S) QLD | 202 | 3 | - | |
| Watiyawanu (CGC) NT | 245 | 3 | - | |
| Warraber (IC) QLD | 221 | 4 | - | |
| Boigu (IC) QLD | 301 | 4 | - | |
| Mamgarr (CGC) NT | 276 | 7 | - | |
| Hammond (IC) QLD | 206 | 18 | - | |
| Angurugu (CGC) NT | 715 | 2 | 1 | |
| Aurukun (S) QLD | 1 022 | 5 | 1 | |
| Kowanyama (S) QLD | 983 | 6 | 1 | |
| |
| - nil or rounded to zero (including null cells) |
4.1 Australia
Figures 6 and 7 are thematic maps showing the proportion of occupied private dwellings with access to the Internet and Broadband by Statistical Divisions of Australia.
Figure 6: Percentages of occupied private dwellings with Internet connection by 2006 Statistical Divisions for Australia.
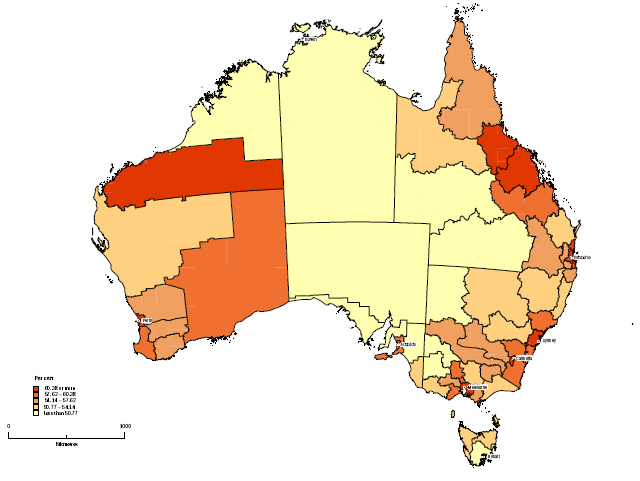 Note: A larger version of this map is available on page 23 of the pdf publication
Figure 7: Percentages of occupied private dwellings with Broadband connection by 2006 Statistical Divisions for Australia.
 Note: A larger version of this map is available on page 25 of the pdf publication
4.2 State/Territory
Figures 8 to 15 are thematic maps showing the proportion of occupied private dwellings with Broadband connection by state/territory by remoteness area at the Collection District (CD) level. Similar maps for Internet connection are available electronically. More maps at the Statistical Local Areas and major Urban Areas are also available electronically in the Maps pdf on the Details tab for this product.
4.2.1 New South Wales
Figure 8: Percentages of occupied private dwellings with Broadband connection by Collection Districts for New South Wales 2006.
 Note: A larger version of this map is available on page 27 of the pdf publication
4.2.1.1 Broadband
The top quintile, comprising mostly CDs from the Sydney urban centre, with at least 55% Broadband connectivity, also contains several CDs from the sparsely populated remote and very remote areas of North Western NSW. CDs in and around the regional centres mostly belong to the second and third quintiles, with connectivity ranging from 35% to 55%. The bottom quintile, with less than 25% connectivity, comprises mostly CDs from remote and outer regional areas, but there are some from inner regional areas as well.
4.2.1.2 Any Internet Access (Map is available from page 1 of the Maps PDF file on the Details Page of this product)
For New South Wales, CDs around Sydney, along with some CDs in inner regional centres such as Armidale, Albury, and Bathurst have the highest level of Internet access (75% or more). Some CDs in north-western NSW (in the far-west Subdivision) in remote and very remote areas figured in the top quintile. The majority of CDs in inner regional areas are at least in the second quintile with at least 70% connectivity. The last quintile, with less than 50% connectivity, mostly comprises CDs from remote and very remote areas, with the exception of some outer regional CDs in North Eastern NSW.
At the SLA level, Ku-ring-gai (A), Baulkham Hills (A) - South, Mosman and Woollahra (A) has the highest rate of Broadband connectivity in Sydney. In the Rest of the State, the SLAs of the Unincorporated Far West and Queanbeyan has the highest rate of Broadband connectivity (55% and 50%) respectively.
In Sydney, the SLA of Fairfield (C), which has 72% of the population speaking a language other than English, has the lowest rate of Broadband connectivity (39%). The SLAs of Sydney with the next lowest rate of Broadband connectivity were Wyong (A) - South and West (40%), Wyong (A) - North-East (40%) and Gosford (C) - West. In all three of these SLAs, there was a relatively high proportion of the population aged 55 years or more (between 27% and 29%).
In the Rest of the State, the SLAs of Dubbo (C) - Part B and Brewarrina (A) has the lowest rate of Broadband connectivity (9% and 11% respectively). In the case of Brewarrina (A), over half of the population's income is lower than $600 per week and nearly two-thirds of the population are Indigenous.
4.2.2 Victoria
Figure 9: Percentages of occupied private dwellings with Broadband connection by Collection Districts for Victoria 2006.
 Note: A larger version of this map is available on page 29 of the pdf publication
4.2.2.1 Broadband
CDs with the highest level of Broadband connectivity are predominantly located in the Melbourne metropolitan region. Major regional centres, with the exception of Geelong, fall in the second or third quintile. The vast majority of CDs in the rest of the state have less than a quarter of the dwellings connected to Broadband, and are in the bottom quintile. Patterns of Broadband access in the Melbourne Metropolitan area are similar to any Internet connectivity.
4.2.2.2 Any Internet Access (Map is available from page 2 of the Maps PDF file on the Details Page of this product)
In Victoria, CDs with the highest level of Internet connectivity are predominantly located in the Melbourne metropolitan region. There are pockets of similar levels of connectivity around major regional centres such as Ballarat, Bendigo and Geelong. CDs in the lowest quintile of connectivity (with less than 50% of dwellings connected) are not located in any particular part of the state, but are scattered across remote, outer regional and inner regional areas. Within the Melbourne Metropolitan area, the inner Melbourne suburbs, and those to the north and east of the city tend to have high connectivity. However, suburbs in the outer northern and north-western part of the metropolitan region, as well as in the Mornington peninsula, have significantly lower connectivity, comparable to the lowest quintile for the State.
The Melbourne SLAs of Melbourne (C) - Southlands-Docklands, Bayside (C) - Brighton and Melbourne (C) - Inner have Broadband connectivity rates in excess of 70%. In the Rest of the State, the SLAs of Newtown, Surfcoast (S) - East, Greater Bendigo (C) - S'saye and Macedon Ranges (S) - Bal have Broadband connectivity rates in excess of 50%.
The Melbourne SLAs of Cardina (S) - South, Mornington Peninsula (S) - South, Yarra Ranges (S) - Central and Brimbank (C) - Sunshine Inner have Broadband connectivity rates less than 40%. In the Rest of the State, the SLAs of Loddon (S) - South, Horsham (RC) - Bal and Wangaratta (RC) - South have Broadband connectivity rates less than 15%. In each of these cases, at least half of the population registered a personal income of less than $600 per week.
4.2.3 Queensland
Figure 10: Percentages of occupied private dwellings with Broadband connection by Collection Districts for Queensland 2006.
 Note: A larger version of this map is available on page 31 of the pdf publication
4.2.3.1 Broadband
Looking at the pattern of Broadband access in Queensland, CDs in very remote areas have significantly higher access rates (with only a few CDs in the bottom quintile) in comparison with inner regional, outer regional and remote parts of the state, with a large majority of CDs in the outer regional areas falling in the lowest quintile with less than 25% Broadband connectivity. CDs in the urban centre of Brisbane have higher levels of connectivity, the lower bound of the third quintile being 45%. The bottom quintile in Brisbane has connectivity of 37% or less.
4.2.3.2 Any Internet Access (Map is available from page 3 of the Maps PDF file on the Details Page of this product)
Looking at the distribution of dwelling Internet access across CDs in Queensland, a good spatial distribution is observed. Although CDs around the urban centre of Brisbane have relatively higher levels of connectivity, there is no clear difference in access patterns across remoteness areas, with several CDs around very remote towns such as Blackall and Charleville falling in the top two quintiles, with at least 70% connectivity. The far north and west of the state mostly fall in the lowest quintile (less than 50%), as does scattered areas in remote and outer regional areas and even inner regional areas. CDs in the urban centre of Brisbane have high levels of connectivity, the lower bound of the third quintile being 66%.
The Brisbane SLAs of Fig Tree Pocket and Mount Ommaney have Broadband connectivity rates of nearly 80%. By contrast, the SLAs in the Rest of the State (Murray and Douglas) with the highest degree of Broadband access have connectivity rates of 60%.
In Brisbane, the SLA of Ipswich (C) - South-West has the lowest rate of Broadband connectivity (9%), which is significantly lower than the next two lowest rates of connectivity which were 29% and 31% in Coolangatta and Jacobs-Well Alberton respectively. Nearly half of the population (46%) in Ipswich (C) - South-West have weekly personal income of less than $600 per week.
For the Rest of Queensland, the lowest 10 SLAs have a negligible rate of Broadband Internet connection (between 0 and 1 percent connectivity). In each SLA, the majority of the population are Indigenous (ranging from 87% to 98% of the population), with a significant share of the population (ranging from 47% to 63%) having a weekly personal income of less than $600 per week.
4.2.4 South Australia
Figure 11: Percentages of occupied private dwellings with Broadband connection by Collection Districts for South Australia 2006.
 Note: A larger version of this map is available on page 33 of the pdf publication
4.2.4.1 Broadband
CDs with the highest level of Broadband connectivity are predominantly located in the Adelaide metropolitan region, with the exception of some sparsely populated CDs in the very remote and remote areas in the northern part of the state, and the Port Augusta region. The vast majority of CDs in the rest of the state have less than a fifth of the dwellings connected to Broadband, and are in the bottom quintile. Patterns of Broadband access in the Adelaide Metropolitan area are similar to any Internet connectivity with less than a quarter of dwellings in the north-western part of the city having Broadband connection.
4.2.4.2 Any Internet Access (Map is available from page 4 of the Maps PDF file on the Details Page of this product)
In South Australia, most of the CDs in the top quintile for Internet connectivity are located in the metropolitan region. However, there are pockets of high connectivity throughout the state of 70% or more, even in remote and very remote areas. CDs in the lowest quintile of connectivity (with less than 45% of dwellings connected) are not located in any particular part of the state, but are mostly scattered across very remote, remote, and outer regional areas. Even within the metropolitan region, considerable diversity is observed, with CDs in the south-eastern part of the city having high connectivity (more than 70%) and clusters of CDs in the north-western part of the city in the bottom quintile, with less than 50% connectivity.
In Adelaide, the SLAs of Burnside (C) - South-West, Adelaide and Burnside (C) - North-East have Broadband connectivity rates in excess of 55 percent. These connectivity rates were lower than the highest connectivity rate of 67 percent for Roxby Downs (M), located in the Rest of the State of South Australia.
In Adelaide, the SLA of Playford (C) - Elizabeth has the lowest Broadband connectivity rate of one-quarter of the population. The next three lowest rates of Broadband connectivity are all SLAs located in Port Adelaide. In each case, at least 55% of the population registered a personal income of less than $600 per week.
In the rest of South Australia, two SLAs (Peterborough (DC) and Anangu Pitantjatjara (AC)) have Broadband connectivity rates of only 2%. In Peterborough (DC) nearly two-thirds of the population registered a personal income of less than $600 per week. In the case of Anangu Pitantjatjara (AC), in addition to low income levels, there are also a high proportion of the population who are Indigenous (84%).
4.2.5 Western Australia
Figure 12: Percentages of occupied private dwellings with Broadband connection by Collection Districts for Western Australia 2006.
 Note: A larger version of this map is available on page 35 of the pdf publication
4.2.5.1 Broadband
CDs with the highest level of Broadband connectivity are mostly in the Perth metropolitan region, with the exception of a few CDs in mining and agricultural areas such as Kalgoorie and Newman. Less than a quarter of the dwellings in the inner and outer regional, and remote areas, in the south-western part of the state have Broadband connectivity. Patterns of Broadband access in the Perth Metropolitan area are similar to any Internet connectivity with less than a third of dwellings in most CDs in the south-eastern part of the city having Broadband connection.
4.2.5.2 Any Internet Access (Map is available from page 5 of the Maps PDF file on the Details Page of this product)
As with other Australian states/territories, most of the CDs in the top quintile for Internet connectivity are located in the metropolitan region. However, there are pockets of high connectivity throughout in the south-western part of the state, and in some mining and agricultural areas such as Kalgoorie and Newman. Rural and very remote areas in the north, east and central parts of the state have the lowest connectivity (less than 50%). There are very few CDs in the two bottom quintiles in the inner and outer regional and even remote areas, in the south-western part of the state, where connectivity is generally above 60%. However, even within the metropolitan region, there are pockets of relatively lower connectivity, markedly in the south-eastern part of the city.
In Perth, the SLA of Peppermint Grove (S) has the highest rate of Broadband connectivity (77%). The next two highest ranking SLAs are Nedlands (C) and Cottesloe (T), which have Broadband connectivity rates of 71% and 70% respectively. In the rest of Western Australia, the SLAs of Capel (S) - Part A and Roebourne (S) has the highest rates of Broadband connectivity (59% and 58% respectively).
In Perth, the SLAs of Belmont (C) and Serpentine-Jarrahdale (S) both have the lowest rate of Broadband connectivity (37%). In the rest of Western Australia, the SLAs of Laverton (S) and Ngaayatarraku (S) both have the lowest rate of Broadband connectivity (5%). Low income levels (below $600 per week of 49% and 54% respectively) and Indigenous profile (58% and 86% Indigenous) are demographic characteristics of these two SLAs.
4.2.6 Tasmania
Figure 13: Percentages of occupied private dwellings with Broadband connection by Collection Districts for Tasmania 2006.
 Note: A larger version of this map is available on page 37 of the pdf publication
4.2.6.1 Broadband
As in the case with all forms of Internet access, CDs with the highest Broadband connectivity levels (38 % or more) are located near the major town centres, Hobart, Launceston, Burnie and Devonport. However, the vast majority of CDs in remote and outer regional areas are in the lowest quintile (16% or less). A few CDs in Inner regional areas also fall in the lowest quintile. Within Hobart, Broadband connectivity patterns are similar to any Internet connection, with CDs in the lowest quintile (25% or less) being mostly concentrated in the northern and eastern parts of the city.
4.2.6.2 Any Internet Access (Map is available from page 6 of the Maps PDF file on the Details Page of this product)
In Tasmania, CDs with the highest Internet connectivity levels (65% or more) are located near the major town centres, Hobart, Launceston, Burnie and Devonport. CDs in inner regional areas are at least in the second quintile with at least 58% connectivity. Areas with lowest connectivity (43% or less) are concentrated in the central and north-western part of the state. Interestingly, distribution in connectivity within Hobart are similar to the rest of the state, with CDs in the lowest quintile (43% or less) being mostly concentrated in the northern and eastern parts of the city.
In Hobart, the SLAs of Hobart (C) - Remainder and Kingborough (M) - Part A have the highest rate of Broadband connectivity (49% and 44% respectively). These connectivity rates are the lowest in comparison to all other states and territories in Australia and are not substantially higher than the highest rates in the rest of Tasmania (West Tamar (M) - Pt A has a Broadband connectivity rate of 44% followed by Meander Valley (M) - Part A, which registered 42% Broadband connectivity).
The SLAs of Hobart with the lowest rate of Broadband connectivity are Derwent Valley (M) - Part A and Brighton (26% and 29% respectively). In the rest of Tasmania, the SLAs of George Town (M) - Pt B, King Island (M) and Central Highlands (M) all have the lowest rate of Broadband connectivity (6%).
4.2.7 Northern Territory
Figure 14: Percentages of occupied private dwellings with Broadband connection by Collection Districts for Northern Territory 2006.
 Note: A larger version of this map is available on page 39 of the pdf publication
4.2.7.1 Broadband
Broadband connectivity has a similar pattern, but connectivity levels are considerably lower, with the top two quintiles having only a minimum connectivity level of 30%, and the bottom quintile having almost no connectivity. CDs around Darwin have about 40% Broadband connectivity.
4.2.7.2 Any Internet Access (Map is available from page 7 of the Maps PDF file on the Details Page of this product)
Although the Northern Territory comprises mostly remote and very remote areas, CDs in the first 3 quintiles have a minimum Internet connectivity of about 40%. CDs around Darwin have about 70% any Internet connectivity on average. Less than 15% of dwellings in the bottom quintile have Internet connectivity.
In Darwin, the SLAs of Gunn-Palmerston City, Brinkin and Wanguri have Broadband connectivity rates of 55% or slightly higher. These rates are lower than the highest rate in the rest of the Northern Territory, which was found in Nhulunbuy, which has a Broadband connectivity rate of 68%.
In Darwin, the SLAs of Lee Point-Leanyer Swamp and Litchfield (S) - Part A have the lowest rate of Broadband connectivity (13% and 15% respectively. In the case of Lee Point-Leanyer Swamp, 70% of the population are aged 55 years or over, while 68% of the population have a personal income of less than $600 per week.
In the rest of the Northern Territory, all of the lowest 10 SLAs have a negligible rate of Broadband connectivity. In all these cases, at least 85% of the population were identified as Indigenous. The SLAs of Watiyaawanu (CGC) and Marngarr (CGC) have a zero rate of Broadband connectivity. In both these SLAs, the majority of the population have a personal income of less than $600 per week (70% and 60% respectively).
4.2.8 Australian Capital Territory
Figure 15: Percentages of occupied private dwellings with Broadband connection by Collection Districts for Australian Capital Territory 2006.
 Note: A larger version of this map is available on page 41 of the pdf publication
4.2.8.1 Broadband
Patterns of Broadband access are similar to any Internet access. Except for the sparsely populated rural and nature park areas surrounding Canberra, at least 45% of the dwellings in most CDs have Broadband connectivity. At least 62% of dwellings in the top quintile have Broadband connectivity. Within Canberra, CDs in the bottom quintile are scattered throughout the city and not concentrated in any particular region.
4.2.8.2 Any Internet (Map is available from page 8 of the Maps PDF file on the Details Page of this product)
With the highest Internet connectivity in the country, the quintile bands for the ACT are narrower and higher than corresponding quintiles in other states/territories. The upper bound for the lowest quintile is higher than the lower bound of the top quintile for South Australia, Tasmania and the Northern Territory, and the lower bound of the second quintile for other states. Except for the sparsely populated rural and nature park areas surrounding Canberra, at least two thirds of the dwellings in most CDs have Internet connectivity. At least 83% of dwellings in the top quintile have Internet connectivity.
In Canberra, the SLAs of Forrest, O'Malley, Fadden and Chapman have Broadband connectivity rates of 75% or more. By contrast, the SLAs in Canberra with the lowest rate of Broadband connectivity are Symonston (20%), Belconnen Town Centre (47%), Lyneham (48%) and Page (48%).
 Print Page
 Print All