ACCURACY
Accuracy remains the main focus of ABS quality control. However, in the case of the national accounts, it is recognised internationally that an objective accuracy measure in the sense of proximity to the 'true value' is impossible to produce. The national accounts are a highly complex set of economic statistics. They combine a very large number of internal and external data sources covering various aspects of the economy to derive GDP and other headline measures.
The national accounts compilation process transforms the various partial data into a set of economic accounts. To make the data more analytically useful it also requires a further transformation of the data to produce the headline chain volume, seasonally adjusted/trend estimates of GDP and components. These measures involve data transformations, requiring various assumptions.
Given the variety of data used, and the transformations and aggregations inherent in the national accounts process, an assessment of accuracy is necessarily subjective and indirect. It involves an assessment of the national accounts process itself, the input data and the various transformations involved in producing the national accounts. The ABS aims to achieve best practice in each of these facets of national accounts compilation. The related quality concept of reliability can be objectively measured by an analysis of revisions, but a reliable series is not necessarily accurate, if it is based on poor quality data.
The international System of National Accounts, 1993 (SNA93) is used as a coordinating and integrating framework for the collection of data and standard definitions, classifications and collection units are based on it. The national accounts system also provides an important basis from which relative priorities for the collection of data for the various aspects of economic activity are assessed. The ABS economic statistics program uses best practice in survey design and operation. The introduction of the new tax system in 2000 has enabled a number of enhancements via the establishment of the Australian Business Register and also the increased opportunity for supplementation of ABS data collections with taxation data. In particular, the scope of the annual economic collection outputs has now been increased to include non-employing businesses.
Because of the data intensive needs of the national accounts system and the cost and respondent load imperatives that apply, it will often be the case that national accounts compilers have to make do with data that is of less than ideal quality and sometimes, significantly so, despite the best scientific basis used in survey design. This is more so for data at a finer level of detail where the standard errors are higher. Even with good survey design, important sources of potential error remain. Survey respondents will not necessarily maintain their own accounting records at the detailed level required for national accounts compilation, or they may misinterpret the requirements or take insufficient care. Monthly and quarterly collections in particular will draw on management accounts which are themselves often preliminary and subject to revision and end of year accounting adjustments. The national accounts compilation process is designed to mitigate input data issues, but good quality input data is essential to good quality national accounts data. Ensuring that the quality of input data is suitable for national accounts requirements is an ongoing focus.
The Australian national accounts range of outputs is consistent with the SNA93 and world's best practice. This is also true for the compilation process used. In particular, the components of GDP in annual terms are confronted and balanced within a supply and use table and the results are used to benchmark the quarterly accounts. Quarterly GDP expenditure, production and income components are not balanced, but the compilation procedures incorporate a review process designed to identify data inconsistencies and improbable movements, so they can be investigated as far as possible before publication. This process is assisted by a quarterly supply and use model that has been developed by the ABS for use as an editing tool.
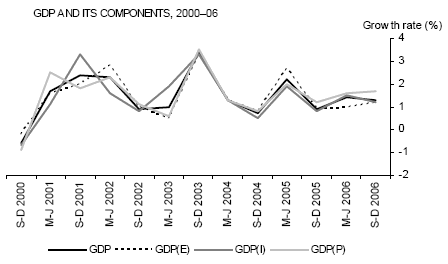
Although the GDP components are fully consistent in annual terms (for years prior to the latest complete year), inconsistencies remain in the quarterly data between the conceptually equivalent expenditure, production and income components. Quarterly GDP is derived in Australia as the average of the three components. The difference between GDP and the components are shown as explicit statistical discrepancy items in the accounts. Graph 1 illustrates the coherence of the data in percentage change terms, thereby providing some indication of the accuracy of the quarterly growth estimates.
Although there are quarter-to-quarter inconsistencies in the data, the important question is whether the data provides a good indication of growth in the economy, or looked at another way, does the information content in the data outweigh statistical noise? From a visual inspection of the data it could be concluded that the picture is mixed, indicating that too much emphasis should not be placed on individual quarters in isolation. Over the 75 quarters from June quarter 1988 (a shorter period is shown in the graph for reasons of clarity), the disparity in growth rates between the strongest and the weakest component was less than or equal to 0.5 percentage points in 25% of quarters and less than or equal to 0.3 percentage points in 10% of quarters. If only the two most consistent data items at each point in time are taken into account, the coherence improves as in 70% of cases the difference is less than or equal to 0.3 percentage points.

However, if the data are viewed on a six monthly rather than a quarterly basis as shown in Graph 2, the timing and other inconsistencies in the GDP components are significantly reduced. The practice of deriving GDP as the average of the expenditure, production and income components acts to smooth out the timing noise in the data and produces a smoother series. GDP is most highly correlated to the production-based measure.

Revisions are an inherent part of the national accounts compilation process. Initial estimates are revised as later and increasingly comprehensive data become available. In part they are a consequence of the demand for estimates to be as timely as possible. The process of establishing different views of the data - chain volume and seasonally adjusted/trend estimates - also results in revisions as new annual price weights are introduced and seasonal factors are re-estimated as new quarters are added and previous quarters are revised. From time to time changes to national accounting standards or upgrades to data sources and methods also result in historical revisions to the whole length of the series.
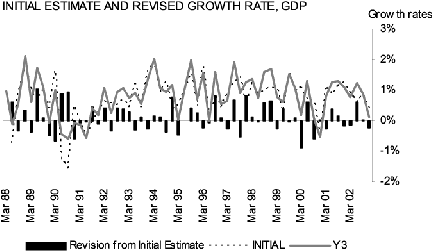
Revisions could be reduced by adopting restrictive practices as to when more complete data can be incorporated into the accounts, but this would likely be at the expense of accuracy. Although users expect revisions, they will want to be satisfied that initial estimates of economic growth contain reliable information about changes in economic conditions. Graph 3 below shows initial estimates of chain volume, seasonally adjusted GDP compared with estimates for the same quarter three years later.
The average spread of revisions in the study period was 0.37 percentage points, compared with the average absolute growth rate of 0.9 percent. One-third of revisions were less than or equal to 0.2 percentage points. Initial estimates successfully indicated that the economy was growing above or below the long term trend rate 75% of the time. Economic measurement is typically more difficult around turning points and recession periods. Initial estimates of GDP successfully identified the turning points surrounding the 1990-91 recession, but indicated a deeper decline in the early period and a stronger temporary recovery in the middle.

Initial estimates of quarterly GDP were revised upwards on average by 0.1 percentage point per quarter. Tests showed this to be statistically significant, although the earlier quarters in the study were the main contributors to this result. This will be the subject of further investigation, but it cannot be concluded that future estimates will also have a tendency to be revised upwards.
OECD research shows that the average spread of revisions to Australia's GDP growth is in the middle of the 18 OECD countries included in their study.
Some component series have been revised substantially, although users could be expected to have a different level of tolerance to revisions depending on a series' volatility. The mean absolute revision to quarterly growth in private gross fixed capital formation was quite high at 2.2 percentage points, but for much of the period the initial estimates provided a reasonable indicator of growth considering the volatile nature of the series. Components that should receive the highest priority for future work are change in inventories, private and public gross fixed capital formation, and government final consumption expenditure. Growth in these series can be substantially revised, and given their volatility they are large expenditure-side contributors to revisions to growth in GDP.
When forming a view about the economy, it could be expected that users of economic data will not only consider the estimates for any one quarter or any one piece of economic data in isolation. The ABS warns that:
'...given the qualifications regarding the accuracy and reliability of the quarterly national accounts, trend estimates provide the best guide to the underlying movements, and are more suitable than either the seasonally adjusted or original data for most business decisions and policy advice' (Australian National Accounts: National Income and Expenditure (cat. no. 5206.0), Explanatory Notes).
Incremental improvements can and are being made to the accuracy of data sources and processes used in the national accounts. However, there are limits to what can realistically be achieved. Putting aside extra data collection costs and respondent load in improving the accuracy of surveys, there are limitations to the quality of data businesses can, or are prepared to, provide the ABS within the time frame needed to produce the quarterly accounts. Initial data in particular should be considered only as indicators to be replaced as more complete data becomes available over time. Even then, quarter-to-quarter timing inconsistencies are likely to remain, although they will eventually be benchmarked to higher quality annual data.
Drawing together knowledge about the accuracy of the input data, the national accounts processes and the revisions history of the estimates, the ABS publishes 'accuracy ratings' for initial estimates of quarterly GDP and components that users can take as a guide when considering fitness for purpose of the data. GDP and high level data items such as domestic final demand, household final consumption expenditure, exports and imports of goods and services and compensation of employees are rated as 'good'. Initial volume estimates of gross fixed capital formation is rated as 'fair' and change in inventories and government final consumption expenditure are rated as 'poor'.
The following table contains an assessment for the initial quarterly estimates of movement for the current price and chain volume estimates of expenditure and income components of GDP. Each component has been assigned one of the following grades:
A good
B fair
C poor
D very poor
 Print Page
 Print All