Disability, Ageing and Carers, Australia: Summary of Findings

Latest release

This release includes analysis and data cubes focusing on national level data as well as relevant explanatory material

Reference period
2018

Next release

The next release of data from the Survey of Disability, Ageing and Carers (2022) is expected to be available in June 2024.

Key statistics

Disability

  • In 2018 there were 4.4 million Australians with disability, 17.7% of the population, down from 18.3% in 2015.
  • The prevalence of disability increased with age - one in nine (11.6%) people aged 0-64 years and one in two (49.6%) people aged 65 years and over had disability.
  • Disability prevalence was similar for males (17.6%) and females (17.8%).
  • 5.7% of all Australians had a profound or severe disability.
  • Almost one-quarter (23.2%) of all people with disability reported a mental or behavioural disorder as their main condition, up from 21.5% in 2015.
     

Of those with disability (living in households): 

  • one-third (33.4%) of those aged 15 years and over had completed year 12 or equivalent, up from 31.4% in 2015
  • one in six (16.1%) aged 15 years and over had a Bachelor degree or above, up from 14.9% in 2015
  • 37.9% of those aged 15-64 years said their main source of personal income was a government pension or allowance, down from 41.9% in 2015
  • 59.7% of people had their need for assistance fully met, down from 62.1% in 2015
  • one in 10 (9.6%) aged 15 years and over had experienced discrimination in the previous 12 months because of their disability, up from 8.6% in 2015
  • labour force participation for those aged 15-64 years has remained stable since 2015 at 53.4%, in contrast to an increase in the participation rate for people without disability (84.1%)
  • 11.4% of those with a profound or severe disability (aged 15-64 years) were working full-time up from 7.9% in 2015.
     

Older people

  • One in every six Australians (15.9% or 3.9 million people) was aged 65 years and over (up from 15.1% in 2015).
  • Most older Australians (persons aged 65 years and over) were living in households (95.3%), with 4.6% living in cared accommodation.
  • Half (49.6%) of all older Australians had disability (similar to 2015).
  • 1.3 million older Australians living at home needed some assistance with everyday activities, and of these, almost two-thirds (65.9%) had their need fully met (down from 69.2% in 2015).
  • Two-thirds (68.1%) of older Australians (who reported income) lived in a low income household (a household earning less than $756 per week).
  • Almost all older Australians had participated in social activities at home (97.4%) or outside their home (94.4%) in the previous three months.
     

Carers

  • There were 2.65 million carers, representing 10.8% of all Australians (down from 11.6% in 2015).
  • Females were more likely to be carers (12.3% of all females) than males (9.3% of all males).
  • There were 235,300 young carers (under the age of 25), down from 274,700 in 2015.
  • 3.5% of all Australians were primary carers.
  • Seven in ten (71.8%) primary carers were women.
  • Over one-third (37.4%) of primary carers had disability, twice the rate of non-carers (15.3%).
  • The most common reason primary carers gave for taking on a caring role was a sense of family responsibility (70.1% of all primary carers).
  • Half (50.2%) of all carers lived in a household in the lowest two equivalised gross income quintiles, twice that of non-carers (25.6%).
Disability

In 2018, 17.7% of all Australians had disability, down from 18.3% in 2015 and 18.5% in 2012. Prevalence was similar for males and females:

  • 17.6% of males, down from 18.0% in 2015 and 18.0% in 2012
  • 17.8% of females, down from 18.6% in 2015 and 19.0% in 2012.
     

The age standardised disability rate was 16.1%, down from 17.0% in 2015 and 17.4% in 2012.

Definitions:

Disability - any limitation, restriction or impairment which restricts everyday activities and has lasted, or is likely to last, for at least six months. For more information see the Methodology.
Age standardisation - removes the effects of age allowing comparisons between two or more populations with different age structures. For more information see the Methodology.

Number of people with disability

The number of people with disability has increased. In 2018, there were 4.4 million people with disability (up from 4.3 million in 2015). Of all people with disability, 1.9 million were aged 65 years and over (up from 1.8 million in 2015):

  • representing almost half (44.5%) of all people with disability (up from 41.9% in 2015 and 40.7% in 2012); and
  • reflecting both an ageing population and increasing life expectancy of Australians.
     

Age and sex

The rate of disability generally increased with age for males and females:

  • 3.7% of 0-4 year olds had disability, increasing to 84.6% of those aged 90 years and over
  • the largest difference between males and females was for children aged 5-14years (12.0% of boys with disability compared with 7.1% of girls).
     

Disability prevalence over time

The pattern of disability prevalence across age was similar between 2015 and 2018, however there were some notable changes among certain age groups:

  • one-quarter (26.9%) of people aged 60-64 years had disability, down from 31.5% in 2015
  • one in ten (9.9%) people aged 35-44 years had disability, down from 12.1%
  • one in five (20.5%) women aged 55-59 years had disability, down from 24.4%.
     

Disability status

Disability status is a measure of the severity of limitations experienced by people with disability. In 2018, of the 4.4 million Australians who had disability, almost 3.9 million people had a limitation with the core activities of communication, mobility or self-care and/or a schooling or employment restriction. As a proportion of the Australian population:

  • 3.2% had a profound limitation
  • 2.6% had a severe limitation
  • 2.4% had a moderate limitation
  • 6.1% had a mild limitation
  • 1.4% had a schooling or employment restriction only.
     

These rates were similar to 2015.

Profound or severe disability by age and sex

Overall, females were more likely to have a profound or severe disability (6.0%) than males (5.5%); however, this was not the case for children. Generally, boys were more likely than girls to have a profound or severe limitation:

  • 3.3% of boys aged 0-4 years, compared with 1.5% of girls
  • 7.5% of boys aged 5-14 years, compared with 3.7% of girls.


This pattern was reversed for older people (older women were more likely than older men to have a profound or severe disability) reflecting, in part, the longer life expectancy of women:

  • almost half (48.6%) of all women aged 85-89 years, compared with 35.6% of men of the same age
  • over two-thirds (66.4%) of women aged 90 years and over, compared with 48.9% of men aged 90 years and over.
     

Definitions:

Profound limitation - greatest need for help, that is, always needs help with at least one core activity
Severe limitation - needs help sometimes or has difficulty with a core activity
Moderate limitation - no need for help but has difficulty
Mild limitation - no need for help and no difficulty, but uses aids or has limitations
Limitation - a person has a limitation if they have difficulty, need assistance from another person, or use an aid or other equipment to perform one or more core activities (communication, mobility and self-care). For more information see the Glossary.

Living arrangements

While most people (95.7%) with disability lived in households, 4.3% lived in cared-accommodation. The likelihood of a person with disability living in cared-accommodation increased with age and disability severity:

  • one in five (19.4%) people with disability aged 80 years and over lived in cared-accommodation, compared with 3.2% of those aged 65-79 years
  • less than 1.0% (13,500) of people aged 0-64 years with disability lived in cared-accommodation
  • more than one in five (21.2%) people with a profound limitation lived in cared-accommodation, compared with 2.7% of those with a severe limitation.

Definitions:

Cared-accommodation - includes hospitals, nursing homes, aged care hostels, cared components of retirement villages, psychiatric institutions, and other 'homes' such as group homes for people with disability where a person must have been a resident, or expected to be a resident, for three months or more. For more information see the Glossary.

Disability prevalence in states and territories

Disability prevalence varied between Australia’s states and territories, due in part to their differing age structures. Most notably:

  • over one-quarter (26.8%) of people in Tasmania had disability, higher than all other states and territories, followed by the Australian Capital Territory and South Australia (both 19.4%).
     

People with disability by state or territory of usual residence - 2018

 All with reported disability
 2015 2018
State or territory of usual residence'000%RSE of Estimate (%)'000%RSE of Estimate (%)
 New South Wales1372.418.12.31346.216.92.0
 Victoria1098.818.52.11098.217.02.2
 Queensland859.018.33.2938.119.12.6
 South Australia382.722.92.4332.519.45.7
 Western Australia362.714.63.1411.516.42.5
 Tasmania131.725.82.8140.126.86.2
 Northern Territory20.711.75.920.711.613.8
 Australian Capital Territory62.016.23.480.019.46.1
Total4290.118.31.14367.217.71.2


There were some states and territories that experienced greater change in disability prevalence between 2015 and 2018:

  • 19.4% of those in South Australia had disability, down from 22.9% in 2015
  • 19.4% of those in the Australian Capital Territory had disability, up from 16.2% in 2015
  • 16.4% of those in Western Australia had disability, up from 14.6% in 2015.
     

Main long-term health conditions of people with disability

Of the 4.4 million Australians with disability in 2018, over three-quarters (76.8%) reported a physical disorder as their main condition (the condition causing them the most problems), similar to 2015 (78.5%).

The most common physical disorder was a musculoskeletal disorder (29.6%, down from 31.4% in 2015), including:

  • arthritis and related disorders (12.7%, no change from 12.7% in 2015)
  • back problems (12.6%, down from 13.8% in 2015).


Of all people with disability, almost one-quarter (23.2%) reported a mental or behavioural disorder as their main condition, up from 21.5% in 2015. The most common mental and behavioural disorders were:

  • psychoses and mood disorders (7.5%, similar to 7.6% in 2015),
  • intellectual and development disorders (6.5%, similar to 6.3% in 2015)
  • neurotic, stress related and somatoform disorders (6.1%) up from 5.2% in 2015.
     

Main long-term health condition by disability status

Those with a profound or severe limitation were more than twice as likely to report a mental or behavioural disorder (34.2%) than those with a moderate or mild limitation (14.5%).

Of those with a profound or severe limitation:

  • 12.4% reported psychoses or mood affective disorders such as Dementia and Alzheimer's
  • 12.1% reported intellectual or development disorders.


Those with a moderate or mild limitation were much more likely to report a physical condition (85.5%) than those with a profound or severe limitation (65.9%).

Of those with a moderate or mild limitation:

  • 16.0% reported arthritis and related disorders
  • 15.3% reported having back problems.

Definitions:

Long-term health condition - a disease or disorder that has lasted, or is likely to last, for six months or more. The SDAC collects information about long-term health conditions and through a series of screening questions, determines whether they restrict a person’s ability to do activities. People whose long-term conditions limit their activities are identified as having disability.
Main condition - for respondents with more than one long-term health condition, their main condition is the one causing the most problems.
Neurotic, stress-related and somatoform disorders - includes phobic anxiety disorders, other anxiety-related disorders, obsessive compulsive disorders, reaction to severe stress and adjustment disorders, dissociative (conversion) disorders, somatoform disorders and other neurotic disorders.

Employment characteristics of people with disability

Labour force participation

Labour force participation for people with disability has remained stable since 2015, in contrast to an increase in the participation rate for people without disability.

In 2018, 2.1 million people with disability living in households were of working age (15-64 years). Of these:

  • over half (53.4%) were in the labour force, compared with 84.1% of those without disability
  • almost half (47.8%) were employed, compared with 80.3% of people without disability
  • 46.6% were not in the labour force, compared with 15.9% of those without disability.
     

Labour force participation by sex

Labour force participation was higher among men with disability than women with disability:

  • 56.1% of men with disability compared with 50.7% of women with disability
  • 31.0% of men with a profound or severe limitation compared with 23.6% of women with a profound or severe limitation.
     

Labour force participation by disability status

Labour force participation declined with the severity of limitation:

  • 59.3% of those with a mild limitation
  • 45.6% of those with a moderate limitation
  • 27.2% of those with a profound or severe limitation.
     

Unemployment

The unemployment rate for people with disability has remained stable since 2015, in contrast to a decrease in the unemployment rate for people without disability (5.3% in 2015 to 4.6% in 2018). In 2018 the unemployment rate was:

  • 10.3% for people with any type of disability (more than twice the rate for people without disability, 4.6%)
  • 12.7% for people with a profound or severe limitation
  • 11.8% for people with a moderate limitation
  • 9.6% for people with a mild limitation.
     

Working full-time

In 2018, just over one-quarter (28.3%) of all people with disability of working age were employed full-time (similar to 2015), compared with more than half (54.8%) of those without disability (also similar to 2015). However, a higher proportion of people with a profound or severe disability were working full-time in 2018:

  • 11.4%, compared with 7.9% in 2015, driven by an increase in women with a profound or severe disability working full-time (9.2% in 2018, up from 5.5% in 2015)
  • 14.6% of men with a profound or severe disability worked full-time, though there was no statistically significant difference from 2015 (10.0%).
     

Employment restrictions

People with disability may experience employment restrictions because of their disability (such as restrictions around the type of job or number of hours they can work or a need for special equipment). In 2018, the following groups with disability had an employment restriction:

  • almost half (47.8%) of those working full-time
  • two-thirds (64.5%) of those working part-time
  • almost three-quarters (73.7%) of those who were unemployed
  • the majority of those not in the labour force (771,300 or 80.5%); and of these, 515,200 were permanently unable to work.

Definitions:

Employment characteristics - all data in this section refers to people with disability aged 15-64 years, living in households.
Labour force participation - refers to people who were employed or unemployed.
Unemployment rate - the number of unemployed people of any group as a proportion of the labour force in the same group.

Education

There have been some increases in education attainment for people with disability. In 2018, among all people with disability aged 15 years and over (living in households):

  • one-third (33.4%) had completed year 12 or equivalent, up from 31.4% in 2015
  • one in six (16.1%) had a Bachelor degree or above, up from 14.9% in 2015
  • 9.2% had an advanced diploma or diploma, up from 8.2% in 2015.
     
  1. Living in households
  2. Excludes those for whom highest level of non-school qualification was not determined

Income

Disability can affect a person’s capacity to work and earn an income. The following results relate to people of working age (15-64 years) who were living in households.

Personal income

In 2018, the median gross personal income of people with disability was $505 per week, less than half (49.7%) that of people without disability ($1016 per week). In 2015, the median gross personal income of people with disability was $465 per week, less than half (48.9%) that of people without disability ($950 per week).

Household income

People with disability were more likely to live in households with a lower equivalised gross household income compared with people without disability. Among those whose household income was known:

  • half (50.2%) lived in a household in the lowest two quintiles, more than twice that of people without disability (24.0%) 
  • 13.5% lived in a household in the highest quintile, compared with 26.5% of people without disability.
     
  1. Living in households
  2. Excludes people whose household income was not known
  3. Includes households with nil income and households who reported no source of income

Definitions:

Equivalised gross household income - adjusts actual income to take into account the different needs of households of different size and composition. For more information see the Glossary.

Main source of income

In 2018, the most common main sources of income for people with disability were:

  • government pension or allowance (37.9%, down from 41.9% in 2015)
  • wages or salary (37.6%), no significant change from 2015 (36.5%).
     

In 2018, a government pension or allowance was the main source of income for:

  • over half (58.6%) of people with a profound or severe limitation, down from 68.5% in 2015
  • over one-third (37.2%) of people with a moderate or mild limitation, similar to 2015 (40.7%).
     

* Estimate has a high margin of error and should be used with caution.

  1. Living in households
  2. Including from own incorporated business
  3. Includes child support or maintenance, workers' compensation, profit or loss from rental property, dividends or interest, superannuation or annuity
  4. Includes persons who reported no source of income, or main source of income was not known.
     

Need for assistance

In 2018, of the 4.2 million Australians with disability (living in households), three in five (59.8% or 2.5 million people) needed assistance with at least one activity of daily life.

Assistance was most commonly needed with:

  • health care (29.9%)
  • property maintenance (27.1%)
  • cognitive and emotional tasks (23.7%).
     
  1. Living in households
  2. Excludes public transport
     

Assistance needs for people with a profound limitation

Among people with disability (living in households) with a profound limitation (613,100 people), the greatest need for assistance was with:

  • mobility (87.1%)
  • health care (73.0%)
  • self-care (65.9%).
     

Whether need for assistance was met

A person who needs assistance with an activity may or may not receive the help they require. Of the 2.5 million Australians with disability (living in households) who needed assistance:

  • most (92.7%) received some help (formal and/or informal) with at least one of the activities they needed assistance with
  • 59.7% had their needs fully met, down from 62.1% in 2015
  • 37.7% had their needs partly met, up from 35.3% in 2015
  • 2.7% did not have their needs for assistance met at all (the same as in 2015).
     

Less than half (48.1%) of those with a profound limitation had their needs fully met, compared with 68.4% of people with a mild limitation.

Assistance received by age

Among certain age groups there has been an increase in the proportion of people with disability whose assistance needs for certain activities were not fully met:

  • one in eight (13.1%) people aged 0-64 years did not have their need for assistance with cognitive and emotional tasks met, up from 10.9% in 2015
  • 7.1% of people aged 65 years and over did not have their need for assistance with household chores met, up from 5.9% in 2015.
     
  1. Living in households
  2. Applies only to persons where need for assistance partly met or not met at all. A person's needs may not be fully met for more than one activity
  3. Excludes public transport
     

Service use

People with disability may be supported by formal and/or informal providers of assistance including government or private organisations, as well as family and friends. They may seek assistance from different providers for their various care needs.

Assistance from informal providers

In 2018, of the 2.5 million people with disability (living in households) who needed assistance, 79.1% received assistance from informal providers. Of those receiving informal assistance:

  • two in five (40.5%) received assistance from a partner, down from 44.2% in 2015
  • over one-quarter (27.3%) received assistance from their child, similar to 2015 (29.3%)
  • over one-quarter (27.0%) received assistance from their parent, up from 24.4% in 2015.
     

​​​​​​​Activities for which informal assistance was received

People with disability (living in households) needing assistance were most likely to receive informal assistance with:

  • communication (88.1% of those needing help with this activity received informal help with this task)
  • mobility (84.8% of those needing help with this activity received informal help with this task)
  • reading or writing tasks (84.8% those needing help with this activity received informal help with this task).
     

Frequency of informal assistance

Information about the frequency of informal care being provided helps our understanding of the extent to which people with disability rely on this informal assistance and can help with future service planning and carer supports. Among those who received informal assistance:

  • just over half (53.2%) received daily assistance
  • just over one quarter (27.2%) received assistance weekly.
     

Assistance from formal providers

Of the 2.5 million people with disability (living in households) who needed assistance, 58.0% received assistance from formal providers (such as private commercial organisations and government providers).

Activities for which formal assistance was received

People with disability (living in households) needing assistance were most likely to receive formal assistance with:

  • health care (54.5% of those needing help with this activity received formal assistance with this task)
  • cognitive and emotional tasks (49.9% of those needing help with this activity received formal assistance with this task)
  • communication (42.5% of those needing help with this activity received formal help with this task).
     

Frequency of formal assistance

Among those who received formal assistance:

  • two in five (40.9%) received formal help monthly
  • over one-quarter (28.2%) received weekly formal assistance
  • 17.9% received formal assistance on a yearly basis.
     

Comparison of informal and formal assistance

Of the 2.5 million people with disability (living in households) who needed assistance, the proportion who received assistance, and whether that assistance was formal or informal, varied across activities. The following graph provides a comparison of the different activities for which formal and informal assistance were most commonly received by those who needed it.

  1. Living in households
  2. Excludes public transport
     

Definitions:

Informal assistance - refers to unpaid help or supervision provided by family, friends and neighbours and only includes help provided because of a person’s disability.
Formal assistance - refers to paid care provided by organisations or individuals. For more information on formal and informal assistance see the Glossary.

Satisfaction with formal assistance

People aged 15 years and over who received formal assistance in the 6 months prior to the survey were asked how satisfied they were with both the quality of service and the range of services available. 

Satisfaction with quality of service

In 2018, among those who received formal assistance with at least one activity, people aged 15-64 years were less likely to be satisfied with the quality of service (59.2%) compared with those aged 65 years and over (72.8%).

Satisfaction varied depending on the type of activity for which the assistance was received as well as by age.

* Estimate has a high margin of error and should be used with caution.

  1. Living in households
  2. Received assistance from an organised service in the previous 6 months
  3. Excludes public transport
     

Satisfaction with range of services

Among those who needed formal assistance with at least one activity:

  • 44.9% of people aged 15-64 years were satisfied with the range of services available compared with 61.2% of those aged 65 years and over 
  • regardless of age, people were most satisfied with the range of health care services available (58.3% of 15-64 year olds and 72.1% of people aged 65 years and over).
     

Aids and equipment

Aids used

People with disability may use aids or equipment to assist with their functioning, improve their independence and increase their participation in social and economic life. In 2018, of the 4.4 million Australians with disability, over half (53.1% or 2.3 million) used aids or equipment because of their condition. Use of aids varied according to a person’s living arrangements. Amongst all those with disability:

  • 58.3% of those who lived alone used aids
  • 49.3% of those who lived with others used aids
  • 94.8% of those who lived in cared-accommodation used aids.
     

People with disability may use a variety of aids or equipment depending on personal and environmental factors, level of impairment or activity limitation, accessibility and affordability. In 2018:

  • 29.4% of people with disability used communication aids, with 18.4% using a hearing aid
  • 17.1% used aids for mobility tasks.
     

For certain activities, people who lived alone were almost twice as likely to use aids or equipment:

  • 19.3% used aids or equipment for self-care, compared with 11.3% of those who lived with others
  • 20.9% used aids for mobility tasks, compared with 12.3% of those who lived with others.
     

Modifications

Of the 4.2 million people with disability living in households, 12.2% (or 511,400) had made home modifications:

  • 8.1% had handgrab rails
  • 5.8% had bathroom, toilet or laundry modifications
  • 2.6% had ramps installed.
     

Social and community participation

Participating in community activities can contribute to a person’s sense of wellbeing and help build social support networks.

In 2018, of the 4.1 million people aged 5 years and over with disability (living in households) three-quarters (76.2%) had participated in social activities away from home in the previous 12 months. Overall, participation in social activities away from home decreased with age. In the previous 12 months:

  • nine out of ten (89.8%) children (aged 5-14 years) with disability participated in social activities
  • eight in ten (80.8%) people aged 15-64 years with disability participated in social activities
  • just over two thirds (68.5%) of people aged 65 years and over with disability participated in social activities.
     

When looking at social and community participation in the previous three months, the most commonly reported activities across all ages and disability levels were:

  • visiting or going out with family and friends
  • participating in physical activity for exercise or recreation.

Definitions:

Social and community participation data - includes data about people living in households aged 5 years and over who participated in one or more activities away from home in the 12 months prior to the 2018 survey.

  1. Living in households
  2. Participated in social activities away from home in the previous 3 months
     

Access to public transport

Public transport can play a critical role in social and economic life, but may be difficult for those with disability. Of the 4.1 million people aged 5 years and over with disability (living in households):

  • 40.9% used public transport
  • over three-quarters (78.4%) could use all forms of public transport, most with no difficulty (65.6%)
  • 6.3% could use some but not all forms of public transport
  • one in seven (14.3%) could not use any form of public transport.
     

The more severe a person’s disability, the less likely they were to be able to use public transport:

  • one in five (20.7%) people with a profound limitation used public transport, compared with 43.7% of those with a mild limitation
  • almost half (47.0%) of people with a profound limitation could not use public transport at all, compared with 8.9% of those with a mild limitation.
     

Difficulty or inability to use public transport

Among people who reported a difficulty or inability to use public transport due to their condition, the most common reasons reported were:

  • issues getting in or out of the vehicle because of steps (42.4%)
  • getting to stops or stations (30.6%)
  • fear or anxiety (23.0%)
  • lack of seating or difficulty standing (21.3%).

Definitions:

Transport data - includes data about people aged 5 years and over living in households, excluding those who did not leave their home.

Disability discrimination

Disability discrimination occurs when people with disability are treated less fairly than others because of their disability. Among people with disability aged 15 years and over (living in households):

  • one in ten (9.6%) had experienced discrimination, up from 8.6% in 2015
  • one in ten (10.3%) women experienced discrimination, up from 8.9% in 2015
  • one in eleven (8.8%) men experienced discrimination, similar to 2015 (8.3%)
  • almost one in five young people aged 15-24 years (18.9%) and 25-34 years (18.2%) experienced discrimination, compared with 3.2% of those aged 65 years and over.
     

There have been statistically significant increases in the experience of discrimination among some age groups:

  • around one in eight (12.9%) people aged 55-64 years, up from 9.4% in 2015
  • 3.2% of people aged 65 years and over, up from 2.1% in 2015.
     
  1. Aged 15 years and over, living in households who had a personal interview
  2. Experienced discrimination in the previous 12 months
     

Experience of discrimination varied by severity of limitation:

  • almost one in five (18.0%) people with a profound or severe limitation experienced discrimination, up from 12.7% in 2015
  • 7.8% of people with a moderate or mild limitation experienced discrimination, similar to 2015 (7.6%).
     

Source of disability discrimination

Of those with disability who experienced discrimination, the most common sources of discrimination were:

  • service and hospitality staff (36.3%)
  • family and friends (21.0%)
  • their employer (20.7%).
     

These rates were similar to 2015.

Disability discrimination in the labour force

Of those with disability in the labour force (aged 15-64 years) who had experienced discrimination, the most common sources of discrimination were:

  • their employer (40.4%)
  • work colleagues (34.5%).
     

Avoiding situations because of disability

In 2018, of the 3.3 million people with disability aged 15 years and over (living in households) almost one-third (33.1%) avoided situations because of their disability in the previous 12 months:

  • three in ten (30.8%) men, increasing from 28.1% in 2015
  • over one-third (35.3%) of women, the same as in 2015
  • over half (51.0%) of people aged 15-24 years, compared with 21.2% of people 65 years and over
  • over half (52.4%) of people with a profound or severe limitation, compared with 28.1% of those with a moderate or mild limitation
  • two-thirds (67.0%) of people with psychosocial disability, higher than any other disability group.
     
  1. Aged 15 years and over, living in households who had a personal interview
  2. Persons may have more than one disability therefore be included in more than one disability grouping
     

Situations avoided

Of those with disability who avoided situations because of their disability, the most common situations avoided were:

  • visiting family and friends (39.2%)
  • going to shops, banks etc. (34.3%)
  • visiting restaurants, cafes or bars (31.8%).
     
  1. Aged 15 years and over, living in households who had a personal interview
  2. Situations avoided due to disability in the last 12 months
     

Results relating to 2015 data can be found in the 2015 Survey of Disability, Ageing and Carers (ABS cat. no. 4430.0).

Definitions:

Discrimination - refers to unfair treatment received because of disability in the previous 12 months.
Discrimination data - includes data about people with disability aged 15 years and over living in households who had a personal interview. 
Service and hospitality staff - includes teacher or lecturer; health staff; bus drivers, retail staff or taxi drivers; restaurant or hospitality staff; or sales assistants.

Older people

Australia’s population is continuing to age. Among the 24.7 million Australians in 2018, one in every six (15.9% or 3.9 million people) was aged 65 years and over, increasing from:

  • 15.1% in 2015
  • 14.3% in 2012
  • 13.3% in 2009 (or 2.9 million people).
     

This represents an estimated 35% increase in the number of older people between 2009 and 2018 (2.9 million to 3.9 million), compared with a 10% increase for those aged 0 to 64 years for this same time period (from 18.9 million to 20.8 million).

A higher proportion of females were aged 65 years and over (16.7%) than males (15.0%), with the difference increasing in older age groups:

  • 12.1% of women and 11.7% of men were aged 65-79 years
  • 4.6% of women and 3.3% of men were aged 80 years and over.
     

​​​​​​​Living arrangements

Most older people (95.3%) were living in households, with 4.6% (181,200 people) living in cared-accommodation. Of all older Australians:

  • men were more likely to be living in households (96.8%) compared with women (94.2%)
  • women living in households were almost twice as likely to live alone (33.7%) than men (18.1%)
  • the likelihood of living in cared-accommodation increased with age from 1.4% of people aged 65 to 79 years (similar to 2015) to 14.3% of people aged 80 years and over (a decrease from 16.1% in 2015)
  • two-thirds (67.2%) of those living in cared-accommodation were women.

Definitions:

Older people - people aged 65 years and over.
Living in households - persons who reside in a private dwelling or self-care retirement village
Cared-accommodation - includes hospitals, nursing homes, aged care hostels and other cared-accommodation. For more information see the Glossary.

Disability in older people

Although the number of older people in Australia has increased, the prevalence of disability in this population has remained stable (49.6% of older people in 2018 compared with 50.7% in 2015). Among older Australians with disability:

  • 35.4% had a profound or severe limitation, similar to 2015 (36.4%)
  • 15.0% had a moderate limitation, similar to 2015 (14.0%)
  • 40.1% had a mild limitation, similar to 2015 (39.5%).
     

Most older people living in cared-accommodation had disability (96.1%). Among older Australians with disability living in cared-accommodation:

  • more than three-quarters (76.9%) were aged 80 years and over
  • almost all (97.9%) had a profound or severe limitation.

Definitions:

Disability - defined as any limitation, restriction or impairment which restricts everyday activities and has lasted, or is likely to last, for at least six months. For more information see the Glossary.

​​​​​​​Need for assistance

In 2018, among all older Australians, 38.0% (1.5 million people) needed assistance with everyday activities, similar to 2015 (38.6%). Older people were most likely to need assistance with:

  • health care (22.5%)
  • property maintenance (20.0%)
  • household chores (16.0%).
     

Overall, older women were more likely to need help with at least one activity (44.3%) compared with men (30.8%). Across all activities, older women reported a greater need for assistance than older men, especially with tasks such as:

  • mobility (17.8% of older women compared with 12.2% of older men)
  • property maintenance (23.9% of older women compared with 15.6% of older men)
  • household chores (21.1% of older women compared with 10.3% of older men).


Service use

Providers of assistance

Australians needing support may seek assistance from formal and/or informal providers for their various care needs. In 2018, of the 1.3 million older people living in households who needed assistance with everyday activities, the most common informal providers of help were their:

  • spouse/partner (33.8%)
  • daughter (21.4%) or son (17.2%).
     

The most common formal providers of assistance for older people living in households were:

  • private commercial organisations (37.5%)
  • government organisations (27.3%).
     

Activities for which assistance was received

Older Australians (living in households) needing assistance were most likely to receive informal help from family or friends with:

  • communication (90.9% of those needing help with this activity received help with this task from family or friends)
  • reading or writing (85.6% of those needing help with this activity received help with this task from family or friends).
     

Those receiving formal assistance from a government service or other organisation were most likely to receive help with:

  • health care (formal assistance received by 65.0% of those needing help with this activity)
  • household chores (formal assistance received by 51.6% of those needing help with this activity).
     
  1. Living in households
  2. Includes assistance from family, friends or neighbours
  3. Includes government, private non-profit and commercial organisations
     

Whether need for assistance was met

Older Australians who need assistance may not always receive the help they require. Of the 1.3 million older Australians living at home who needed assistance:

  • most (92.3%) received some help (formal and/or informal) with at least one of the activities they needed assistance with
  • almost two-thirds (65.9%) said their need for assistance was fully met, down from 69.2% in 2015
  • 31.0% said their need was partly met, up from 27.7% in 2015
  • 3.1% said their need was not met at all, the same as in 2015.
     

For older Australians (living in households) needing assistance, the tasks most likely to have been fully met were:

  • reading or writing tasks (91.8%)
  • meal preparation (90.2%)
  • communication (89.6%).
     

Assistance needs most likely not met at all were:

  • property maintenance (9.5%)
  • cognitive or emotional tasks (6.4%).
     
  1. Living in Households
     

Overall, the assistance needs of older men and women were equally likely to have been fully met (66.8% of men compared with 65.0% of women). However, when looking at the assistance received across specific activities, older women were:

  • more likely to have their needs for communication assistance fully met (91.2% of older women compared with 79.4% of older men)
  • less likely to have their needs fully met for reading or writing tasks (87.6% of older women compared with 93.7% of older men) and household chores (76.9% of older women compared with 83.9% of older men).

Definitions:

Informal assistance - refers to unpaid help or supervision provided by family, friends and neighbours and only includes help provided because of a person’s disability.
Formal assistance - refers to paid care provided by organisations or individuals. For more information on formal and informal assistance see the Glossary.

Main long-term health conditions of older Australians

Of the 3.9 million older Australians in 2018, almost nine in ten (86.5%) reported having one or more long-term health condition (the same as 2015). The likelihood of having at least one long-term health condition generally increased with age, with:

  • around four in every five (81.2%) people aged 65 to 74 years having at least one long term health condition
  • almost all (98.1%) of those aged 85 years and over having at least one long term health condition.
     

Main long-term health condition

In 2018, the most common main long-term health conditions among older people were:

  • arthritis and related conditions (15.6%), more common amongst older women (19.5%) than older men (11.2%)
  • hypertension (9.1%)
  • back problems (8.7%).
     

In 2018, the proportion of older Australians with a mental or behavioural condition, as a main long-term health condition, increased with age. This was largely due to rates of Dementia or Alzheimer’s increasing with age. This pattern was similar to 2015:

  • 0.7% of people aged 65 to 74 had Dementia/Alzheimer’s as their main condition (similar to 0.6% in 2015)
  • 3.6% of people aged 75 to 84 had Dementia/Alzheimer’s as their main condition (similar to 3.2% in 2015)
  • 12.6% of people aged 85 years or more had Dementia/Alzheimer’s as their main condition (similar to 11.6% in 2015).
     

Definitions:

Long-term health condition - a disease or disorder that has lasted, or is likely to last, for six months or more.
Main condition - the condition identified as causing the most problems. For more information see the Glossary.

Housing and income of older Australians

Housing tenure

Many older people have accumulated assets, such as their own home, to support their retirement. In 2018, for all older Australians living in households:

  • almost three-quarters (72.3%) owned their homes outright, similar to 2015 (71.7%)
  • one in ten (10.3%) had a mortgage, similar to 2015 (9.5%)
  • 12.0% rented their home, similar to 2015 (12.5%)
  • the remaining 5.4% lived rent free or had other housing arrangements, such as life tenure and shared equity schemes, similar to 2015 (6.3%).
     

Main source of income

In 2018, the main source of income for older Australians was:

  • government pension or allowance (56.9%), decreasing from 62.9% in 2015
  • superannuation, an annuity or private pension (20.6% ), increasing from 17.6% in 2015
  • wages or salary (8.2%), increasing from 6.9% in 2015.
     

Older people with disability were more likely to receive a government pension (68.3%) than older people without disability (46.6%).

Income level

In 2018, the median gross personal income of older people was $454 per week, increasing 6.8% from $425 in 2015. In comparison, the median gross income of people aged 15-64 years increased by 11.4% over this same time period (from $863 to $961).

Of those older Australians who reported their income:

  • two-thirds (68.1%) lived in a low income household (a household earning less than $756 per week), similar to 2015 (67.4%)
  • just 6.7% lived in a high income household (a household earning more than $1,680 per week).
     
  1. Living in households
  2. Excludes people whose household income was not known
  3. Includes households with nil income and households who reported no source of income

Definitions:

Equivalised gross household income – adjusts actual income to take into account the different needs of households of different size and composition, for more information see the Glossary.
Quintiles - ranking all households in ascending order according to household income and then dividing the population into five equal groups, each comprising 20% of the estimated population, for more information see the Glossary.

Social and community participation

Social participation

In 2018, almost all older Australians (living in households) had participated in social activities at home (97.4%) or outside their home (94.4%) in the previous 3 months. Common activities included:

  • telephone calls (92.2%) or visits (89.7%) from family or friends
  • visiting (86.8%) or going out (74.1%) with family or friends
  • sport or recreation with others (32.5%)
  • holidaying with others (27.9%).
     

Although older women were more likely to socialise in their home (98.2% compared with 96.4% of men), older men and women were equally likely to socialise away from home (94.6% and 93.9%).

Sport and physical activity

Of all older Australians (living in households) nearly half (48.8%) participated in physical activities for exercise or recreation in the previous 12 months, similar to 2015 (49.2%).

  • around one-quarter (21.7%) of men participated in sport, similar to 2015 (23.4%)
  • women's participation in sport remained stable (13.2% compared with 13.1% in 2015)
  • almost one-quarter of older Australians (23.3%) attended a sporting event as a spectator
  • men were more likely be a spectator at a sporting event than women (29.0% compared with 18.1%).
     

Cultural activities

In 2018, around three-quarters (76.6%) of all older people (living in households) had participated in one or more cultural activity in the previous 12 months, similar to 2015 (76.8%):

  • around half (49.2%) went to the movies, a concert, the theatre or a performing arts event
  • around one-quarter (24.2%) had been to a museum or art gallery.
     

Volunteering

In 2018, around one in six (17.8%) older Australians (living in households) had volunteered in the community in the previous 3 months, similar to 2015 (18.6%).


Results relating to 2015 data can be found in the 2015 Survey of Disability, Ageing and Carers (ABS cat. no. 4430.0). 

Definitions:

Social participation - refers to participation in social or physical activities in the 3 months prior to the survey, or participation in cultural or physical activities in the 12 months prior to the survey.

Carers

The 2018 SDAC showed that the number of carers has decreased to 2.65 million, down from 2.70 million in 2015.

In 2018:

  • around one in nine (10.8%) Australians provided unpaid care to people with disability and older Australians, down from 11.6% in 2015
  • 3.5% (861,600 people) of all Australians were primary carers - the carer who provided the most assistance to a person with disability (similar to 3.7% or 855,900 people in 2015)
  • around 1 in 11 carers (235,300 people) were under the age of 25, down from 274,700 in 2015.
     

Overall, females were more likely to be carers than males with 12.3% of all females providing care in 2018 (similar to 12.8% in 2015), and 9.3% of all males (down from 10.4% in 2015).

For more information on carers see the relevant Appendix.

Definitions:

Carer - a person who provides any informal assistance (help or supervision) to people with disability or older people (aged 65 years and over). Carers can be split into two groups:
Primary carer - a person aged 15 years and over who provides the most informal assistance to a person with disability for the core activities of mobility, self-care and communication.
Other carer - a person of any age who provides unpaid care with one or more of the core activity tasks but is not the main provider of informal care (i.e. not a primary carer); or a person who only provides assistance with non-core activities.

​​​​​​​All carers - age and sex

The rate of caring generally increased with age:

  • from 1.0% of those aged under 15 years to 19.7% of those aged 55 to 64 years
  • from the age of 65 years, the rate of women providing unpaid care declined (from 20.3% of those aged 65 to 74 years to 12.1% of those 75 years and over)
  • the rate of men providing unpaid care remained fairly consistent from 65 years of age (17.3% of those aged 65 to 74, and 19.0% of those 75 years and over).
     
  1. Living in households
     

​​​​​​​Primary carers

Primary carers are those who provide the most assistance to a person with disability with one or more of the core activities of mobility, self-care or communication. Their lives are often significantly impacted by their caring role. Much of the remaining analysis focuses on primary carers.

  • Among the 2.6 million carers, one-third (32.6%) were identified as primary carers
  • overall, women were 2.5 times more likely than men to be a primary carer (5.0% compared with 2.0%)
  • women represented seven in every ten primary carers (71.8%)
  • the average age of a primary carer was 54 years (51 years for carers overall and 50 years for other carers).
     
  1. Includes only persons living in households
  2. By definition, primary carers are aged 15 years and over
     

​​​​​​​Disability status of primary carers

Primary carers provide care to someone with disability, but can also be living with disability themselves.

  • Over one-third (37.4%) of primary carers had disability, twice the rate of non-carers (15.3%)
  • 44.3% of male primary carers had disability, compared with 35.0% of female primary carers
  • a similar proportion of male and female primary carers reported having a profound or severe limitation (7.2% of males and 6.8% of females)
     

See Glossary for more information on disability limitation/restriction severity levels.

​​​​​​​Primary carers - age and sex

The overall pattern across age for primary carers was similar to that for all carers, with the rate of primary carers increasing to the age of around 64 years:

  • 0.6% of those aged 15-24 years provided primary care compared with 7.1% of those aged 55-64 years
  • 6.7% of those aged 65-74 were primary carers while the rate declined to 5.3% of those aged 75 years and over.
     

Proportionally, there were more female primary carers in all but the youngest and oldest age groups. When considering the number of carers however, there were a greater number of female carers than male carers in all age groups with the exception of those aged 75 years and over, with some age groups having double the number of female carers compared with males. In particular there were:

  • 148,900 female primary carers aged 55-64 years, more than twice the number of male primary carers of the same age group (57,000)
  • 148,300 female primary carers aged 45-54 years, almost three times the number of male primary carers of the same age group (50,100).
     

​​​​​​​Recipients of care

The SDAC collects information about both the carer and recipients of care, allowing for comparison of this relationship, which varies with age.

In 2018, primary carers most commonly provided care to:

  • a spouse or partner (36.6%)
  • their child (27.1%)
  • a parent (26.2%).
     

In 2018, of all primary carers:

  • over half (54.8%) of those providing care to a spouse or partner were aged 65 years and over
  • the majority (88.1%) of those providing care to a child were female, almost half of which were aged between 25 to 44 years (48.5%)
  • almost two-thirds (64.9%) of those providing care to a parent were aged between 45 and 64 years.
     

​​​​​​​Living arrangements

The majority of primary carers (79.1%) resided in the same household as the person for whom they provided the most care. Of primary carers who did not live with their main recipient of care:

  • two-thirds (67.0%) were caring for a parent
  • a large proportion (64.6%) were aged between 45 and 64 years.
     

​​​​​​​Assistance provided

Carers provide help with both core and non-core activities (see Carers Appendix for detail). These activities can range from helping someone to eat or bathe, to helping them with their finances, health care or property maintenance.

​​​​​​​Core activities

In 2018, over half of all primary carers said they assisted or supervised the main person they cared for with the following core activities:

  • mobility tasks (74.0%)
  • self-care (56.5%)
  • communication (54.1%).
     

In terms of the specific mobility activities for which primary carers provided help:

  • two thirds (65.6%) helped the person they care for to move around when they were away from home
  • three in ten (28.7%) helped the person they care for to get in or out of a bed or chair.
     

Among primary carers who assisted with self-care activities:

  • two in five (41.5%) assisted with dressing (a decrease from 44.9% in 2015)
  • around one-third (35.8%) assisted with bathing and showering (similar to 36.8% in 2015)
  • around one in five (18.7%) provided assistance with toileting activities (similar to 18.5% in 2015).
     
  1. Primary carer may have provided more than one type of assistance
     

​​​​​​​Non-core activities

Nearly all primary carers (98.9%) helped the main person they cared for with non-core activities:

  • 85.9% assisted with transport, with three quarters (75.9%) driving the person for whom they cared to places away from home
  • 83.2% provided cognitive and emotional support (an increase from 79.4% in 2015). Most often, this referred to coping with feelings or emotions (75.9%).
     
  1. Primary carer may have provided more than one type of assistance
     

​​​​​​​Reasons for taking on a caring role

In 2018, the three most common reasons primary carers gave for taking on a caring role were:

  • a sense of family responsibility (70.1%) similar to 2015 (66.9%)
  • emotional obligation (46.6%) similar to 2015 (44.2%)
  • ability to provide better care than anybody else (46.4%) similar to 2015 (50.3%).
     

However, there was some variation, by age of care recipient, in terms of other common reasons given for taking on a caring role.

Among those who were primary carers to someone aged 65 years or over, over one-third (35.1%) said that no other friends or family were available to provide care compared with primary carers of recipients under 65 years of age (28.8%).

Among primary carers of those aged under 65 years, one-quarter (24.6%) said alternative care was too costly, compared with 17.2% of primary carers of people over 65 years.

  1. Proportions have been calculated using totals that exclude 'not stated' responses
  2. Respondents may have provided more than one reason for taking on caring role
     

The reasons for taking on a caring role also depended on the relationship a primary carer had to the main recipient of care:

  • three-quarters (78.6%) of those caring for a parent felt it was the responsibility of a family member to provide the care, compared with 71.5% of parents caring for a child and 66.8% of those caring for a spouse or partner
  • one-third (34.3%) of those caring for their child said they had no other choice, compared with 21.8% of those caring for a spouse or partner and 14.4% of those caring for their parent.
     
  1. Proportions have been calculated using totals that exclude 'not stated' responses
  2. Respondents may have provided more than one reason for taking on caring role
     

Employment

In 2018, among carers aged 15-64 years (living in households):

  • seven in ten (70.9%) were in the labour force, similar to 2015 (70.8%)
  • primary carers were less likely to be in the labour force (58.8%) than other carers (76.6%) and non-carers (81.5%)
  • carers were less likely to be employed (66.6%) than non-carers (77.4%)
  • 71.8% of all male carers were employed, compared with 63.2% of all female carers.
     

Of primary carers of working age (15-64 years), 55.5% were employed; however, employment status varied with the hours of care per week that a primary carer was providing:

  • less than one-third (28.6%) of primary carers providing more than 40 hours of care a week to their main recipient were employed
  • in comparison, over half (52.8%) of those caring for the main recipient for less than 20 hours of week were employed.
     

Income of carers

Income level

Undertaking a caring role can affect a person’s capacity to work and earn an income. The following results relate to carers of working age (15-64 years) who were living in households and whose income was reported.

In 2018, the median gross personal income of all carers was $800 per week, increasing from $700 in 2015. In comparison the median gross income for non-carers was $997 (up from $900 in 2015).

Primary carers were more likely to live in households with a lower equivalised gross household income. Of primary carers who reported their income:

  • half (50.2%) lived in a household in the lowest two quintiles, twice that of non-carers (25.6%)
  • 13.2% lived in a household in the highest quintile, compared with 25.8% of non-carers.
     

Main source of income

In 2018, the main source of income for carers was:

  • wages or salary (56.1%, increasing from 53.0% in 2015)
  • government pension or allowance (24.1%).
     

Primary carers were more than twice as likely to receive a government pension or allowance (38.4%) than other carers (17.2%) and non-carers (9.2%).

Definitions:

Carers income data - data refers to carers aged 15-64 years, living in households. Excludes people whose household income was not known.
Equivalised gross household income - adjusts actual income to take into account the different needs of households of different size and composition. For more information see the Glossary.

Social and community participation of primary carers

In 2018, almost all (93.4%) primary carers had participated in one or more social activity away from home, similar to 2015 (94.2%). Three-quarters (76.6%) of primary carers had participated in social activities away from home without the person for whom they provided care, also similar to 2015 (76.0%).

The more hours of care provided, the less likely a primary carer was to participate in social activities away from home:

  • of those who provided 40 hours or more care per week, two-thirds (65.7%) participated in social activities away from home
  • of those who provided 20-39 hours of care, 76.1% participated in social activities away from home
  • of those who spent less than 20 hours caring per week, 87.6% participated in social activities away from home.
     

Primary carer participation in cultural or physical activities away from the home gradually decreased with age with:

  • 68.4% of primary carers aged 15-34 years participating in these activities
  • 57.1% of primary carers aged 65 years and over participating in these activities.
     

Results relating to 2015 data can be found in the 2015 Survey of Disability, Ageing and Carers (ABS cat. no. 4430.0).

Definitions:

Participated in social activities away from home - asked of people in relation to the 3 months prior to the survey.
Participated in cultural or physical activity away from home - asked of people in relation to the 12 months prior to the survey.

Autism in Australia

In 2018:

  • there were 205,200 Australians with autism, a 25.1% increase from the 164,000 with the condition in 2015.
  • males were 3.5 times more likely than females to have the condition, with prevalence rates of 1.3% and 0.4% respectively.
     

​​​​​​​What is autism?

Autism is a developmental disorder which affects how a person communicates and relates to other people. It is a lifelong condition (Endnote 1). Autism can be characterised by difficulty in social communication; difficulty in social interaction; and restricted or repetitive behaviours and interests (Endnote 2).

Autism may present substantial challenges for those affected, their families and friends. As noted above, the condition is lifelong, although the social, communication and sensory deficits that some experience may be remediated with the use of intervention therapies and structured support. Autism spectrum disorders are diagnosed on the basis of behavioural and developmental criteria (Endnote 3).

This article uses results from the 2018 Survey of Disability, Ageing and Carers (SDAC) to present an updated analysis of the prevalence of autism in Australia, and the impact the condition has on the everyday lives of those affected by the condition.

Throughout the article, ‘autism’ and ‘autism spectrum disorders’ are used to denote conditions including autism spectrum disorder, Asperger’s Syndrome, Pervasive Developmental Disorder – Not Otherwise Specified, Rett Syndrome and Childhood Disintegrative Disorder. Descriptions of these disorders can be found in the Diagnostics and Statistics Manual of Mental Disorders (DSM) IV-TR and the DSM 5.

​​​​​​​Does prevalence change with age?

There is variation in the prevalence of autism across age groups, with a marked drop off commencing in the late teens. Data are not presented in any detail for people aged over 40 years because the identified prevalence rates are too low for reliable estimates to be produced.


There are several possible reasons for the variation in autism prevalence across the lifespan between the 2015 and 2018 SDACs. These reasons are explored in the ‘Understanding autism prevalence’ section of this article.

​​​​​​​Autism and education

School is an important social environment where children learn to interact with their peers, a task people with autism may find difficult. An appropriate school environment can provide opportunities to develop important social and life skills. Many children on the autism spectrum struggle socially, needing additional support throughout their education.

In 2018, 92.3% of young people (101,900) aged 5 to 20 years on the autism spectrum attending school had some form of educational restriction (92.3%), including a small number who were unable to attend school because of their disability. Two in five (40.8%) of the children attended a special class in a mainstream school or a special school.

Of the 106,600 young people (aged 5 to 20 years) with autism who were attending school or another educational institution, 77.7% reported experiencing difficulty at their place of learning. Of those experiencing difficulties, the main problems encountered were fitting in socially (59.8%), learning difficulties (55.3%) and communication difficulties (51.5%).

  1. Living in households
     

Young people (aged 5 to 20 years) with autism may need a high level of support to participate in their education. In 2018, two in five (40.4%) young people with autism needed special tuition and 32.0% needed help from a counsellor or disability support person, while more than one in four (28.5%) did not receive any additional assistance (excluding attending a special school or special classes in a mainstream school).

Almost half the young people with autism aged 5 to 20 years (45.9%) indicated they needed more support or assistance at school then they were receiving.

People with autism are less likely than others to complete an educational qualification beyond school and have needs for support that differ from people with other disabilities. Of those with autism, 8.1% had a bachelor degree or higher, compared with 16.1% of those with a disability and 31.2% of those without disability. All people with disability and those with no disability were also more likely to have an Advanced Diploma, Diploma or Certificate III or IV than people with autism.

  1. Living in households
     

​​​​​​​Autism and work

Participation in the workforce is important for social inclusion and economic independence, but people with autism spectrum disorders may encounter barriers to entering the labour market.

The labour force participation rate was 38.0% among the 94,600 people of working age (15-64 years), living with autism spectrum disorders. This is compared with 53.4% of all working age people with disability and 84.1% of people without disability.

The unemployment rate for people with autism spectrum disorders was 34.1%, more than three times the rate for people with disability (10.3%) and almost eight times the rate of people without disability (4.6%).

​​​​​​​Severity of disability

In 2018, among all people with autism, 68.9% (141,400) reported having a profound or severe core activity limitation, that is, they need help or supervision with at least one of the following three activities: communication, self-care and mobility.

Almost half (44.1%) of all people with autism had a profound or severe communication restriction. This indicates they needed assistance at least some of the time to understand or be understood by others, for example they may communicate more effectively using sign language or other forms of non-verbal communication.

Similarly, one in two (50.9%) of all people with autism had a profound or severe mobility restriction, indicating that they needed help or supervision to move around.

Just over one third (36.0%) of all people with autism had a profound or severe self-care limitation, indicating they need support or supervision with dressing, bathing, eating or toileting.

​​​​​​​What assistance with everyday activities do people with autism need?

People with autism may need assistance with a range of activities, with the highest level of need being in the areas of cognitive and emotional support and mobility.

Additionally, the frequency with which people with autism needed assistance was high, with 125,200 (61.0%) needing assistance with at least one activity on a daily basis. About two in five people (39.2%) needed assistance with cognitive and emotional tasks at least once a day, while three in ten needed assistance with self-care (30.9%) and mobility (33.2%). For a description of what tasks are included in each of these activities, please see the Glossary.

​​​​​​​What assistance with everyday activities do people with autism receive?

People with autism may receive assistance from a range of providers depending on their needs.

Notably, the bulk of care was provided by informal carers (relatives or friends), in the core activity areas of self-care, mobility and communication. The graph below shows the proportion of all people with autism who received assistance with at least one of the core activities by the source of that assistance.

  1. Living in households
     

​​​​​​​Unmet need for assistance

The 2018 SDAC found that of the people with autism who required assistance (170,100) many did not receive some or all of the assistance they needed, with over half (51.7%) indicating they needed more help with at least one activity. The unmet need for assistance was highest for cognitive and emotional support (61,000 people), communication (30,100) and mobility (21,700).

Understanding autism prevalence

This section examines factors which may have influenced the number of people identified as having autism between the 2015 and 2018 SDAC, and the changes in estimated prevalence of autism across age groups.

​​​​​​​Why does autism prevalence change with age?

As noted above, the 2018 SDAC estimated there were 205,200 people with autism, 25.1% more that the number estimated in the 2015 SDAC (164,000).

The 2018 SDAC estimated higher prevalence rates among children and younger people, but much lower rates among older people (see the first graph). This pattern of incidence by age group mirrors that recorded by the 2015 SDAC, indicating that for both surveys there were age-related factors influencing identification of people with these conditions.

Has the way in which autism is diagnosed changed over time?

The criteria used to clinically diagnose autism have been subject to some variation over time and this may have impacted the reported prevalence of autism in Australia. One of the key tools used as the basis for clinically diagnosing autism is the DSM as it describes diagnostic criteria clinicians can use in determining which mental and behavioural disorders people might have.

Changes to the DSM over time that relate to autism have been significant. The first two versions of the DSM (DSM (I) and DSM (II)) indicated that children with behaviours and/or characteristics symptomatic of autism should be classified as having ‘childhood schizophrenia’.

Diagnostic criteria explicitly for autism were added for the DSM (III), released in 1980. These criteria were then amended for the DSM III (Revised), released in 1987 and revised again in the DSM IV, released in 1994.

Changes to the DSM have impacted the amount of detail considered in diagnosing autism and the number of criteria that need to be met for a diagnosis to be made and these changes may have been a factor influencing diagnosis rates, alongside enhanced understanding of the condition among clinicians.

The changes to the DSM that were made in 1994 would have had a significant impact on diagnosis rates, and this correlates with the fact that the majority of identified cases are among those people who were born after this date (i.e. under 25’s).

Refinements to the DSM continue, with DSM 5 released in 2013. Changes to the criteria in DSM 5 have likely influenced reported autism rates (Endnote 4).

Changes in the DSM are likely to have significantly impacted the number of people clinically diagnosed with autism over time, and can provide an insight into the decrease in prevalence by age.

Does the survey contribute to the observed change in prevalence across the life span?

The design of the SDAC may also influence the observed drop in autism prevalence as people age. The first stage of the SDAC interview, in which it is identified whether there is a person with disability living in the household, is asked of the first responsible adult with whom the interviewer makes contact. In instances where a child is living at home with their parents, it is more common for a parent to provide the responses to these questions. However, when people are in their late teens and start moving out of home, they will be more likely to answer these questions for themselves and this may affect their propensity to identify as living with autism, although the exact level of this impact is unknown.

It should be noted there were no changes in the questionnaire between the 2015 and 2018 surveys that would have impacted on the likelihood of a person being identified as having autism.

What else might be impacting on the drop in autism prevalence with age?

There are other factors that may also be impacting on the change in prevalence with age. People may learn coping strategies as they mature and no longer feel they are restricted in any of the areas of limitation considered in the SDAC. Similarly, intervention therapies may effectively remediate the challenges of autism for some, allowing them to function without experiencing limitations in their everyday activities.

It is also possible that people are less likely to identify a child as having autism as they get older because there is some sensitivity around the issue, either for the person or for the other family members.

There is some evidence indicating there is another reason there are far fewer older people with autism than young people. Research in a small number of countries, including Australia (Endnote 5), suggests people with autism have a substantially lower life expectancy than the rest of the population.

While each of these factors described above may have had an impact on the reported prevalence rates, it is not possible to quantify the size of the influence they may have had. It should be noted the growth seen in autism prevalence in the 2018 SDAC is consistent with growth in prevalence observed by other sources.
 

Bibliography

Show all

  1. National Autistic Society, reviewed at https://www.autism.org.uk/about/what-is.aspx
  2. Autism Spectrum Australia, reviewed at https://www.autismspectrum.org.au/content/what-autism
  3. Centre for Disease Control and Prevention (2018). Reviewed at https://www.cdc.gov/ncbddd/autism/facts.html
  4. Kulage, K.M., Goldberg, J., Usseglio, J., Romero, D., Bain, J.M. and Smaldone, A.M. (2019). How has the DSM-5 Affected Autism Diagnosis? A 5-Year Follow-Up Systematic Literature Review and Meta-analysis. Journal of Autism and Developmental Disorders. doi:10.1007/s10803-019-03967-5.
  5. Hwang, Y.I., Srasuebkul, P., Foley, K., Arnold, S. and Trollor, J.N. (2019). Mortality and cause of death of Australians on the autism spectrum. Autism Research, 12:806-815. Doi:10.1002/aur.2086

Children with disability

Many Australian children are affected by disability. These disabilities can impact a child's health, communication, mobility or learning which can have profound effects on the child's social engagement and education. For primary carer parents and their families, raising a child with disability can have significant effects on many aspects of family life. This article focuses on children aged under 15 years and living in households.

In 2018,

  • 357,500 or 7.7% of children under 15 were reported as having disability
  • the proportion of children with disability increased from 6.9% (295,900) in 2012.

Definitions:

Disability - any limitation, restriction or impairment which restricts everyday activities and has lasted, or is likely to last, for at least six months. For more information see the Glossary.

​​​​​​​Age and sex

The prevalence of disability increased with age, from 3.7% of children aged 0-4 years to 9.6% of those aged 5-14 years.

Boys were more likely than girls to have disability (9.6% or 230,100 boys compared with 5.7% or 128,700 girls). This was also reflected in the different age groups, with 4.8% of boys (38,100) in the 0-4 year age group reporting disability compared with 2.7% of girls (20,200); while 11.9% of boys (189,300) aged 5-14 years reported disability compared with 7.1% of girls (107,700).

  1. Living in households


Children in inner regional areas were more likely to have disability than children in major cities (10.4% or 80,400 compared with 7.0% or 239,700). However, boys in inner regional areas were twice as likely as girls in inner regional areas to have disability (13.5% or 52,800 boys compared with 6.6% or 25,100 girls).

Severity of disability

Of all children, 4.5% (209,300) had profound or severe disability and 1.6% (72,800) had moderate or mild disability. Boys were twice as likely as girls to have profound or severe limitations (6.0% or 143,800 compared with 3.0% or 67,200).

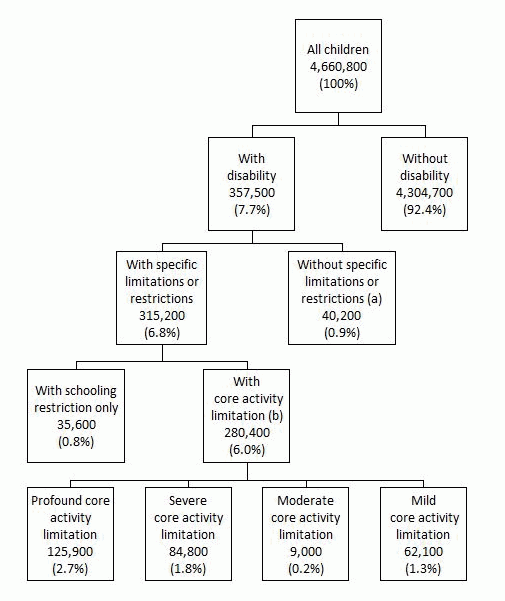
Conceptual framework: children living in households aged 0-14 years. 2018

Children living in households aged 0-14 years. 2018

Definitions:

Profound limitation - greatest need for help, that is, always needs help with at least one core activity
Severe limitation - needs help sometimes or has difficulty with a core activity
Moderate limitation - no need for help but has difficulty
Mild limitation - no need for help and no difficulty, but uses aids or has limitations
Restriction (education) - difficulty participating, needs assistance from another person or uses an aid or equipment in schooling.
Limitation - a person has a limitation if they have difficulty, need assistance from another person, or use an aid or other equipment to perform one or more core activities (communication, mobility and self-care). ) For more information on the terms used, refer to the Glossary and appendices associated with this publication.

Image shows:
All children: 4,660,800 (100%), made up of:

  • All children without disability: 4,304,700 (92.4%)
  • All children with disability: 357,500 (7.7%), comprising Children with disability without specific limitations or restriction: 40,200 (0.9%) and Children with disability with specific limitations or restrictions 315,200 (6.8%).
  • This Children with disability with specific limitations or restrictions group(a) (40,200 (0.9%)) comprises Children with disability with schooling restriction only: 35,600 (0.8%) and Children with disability with core activity limitation(b): 280,400 (6.0%).
  • The Children with disability with core activity limitation(b) group (280,400 (6.0%)) comprises Children with disability with profound core activity limitation: 125,900 (2.7%), and Children with disability with severe core activity limitation: 84,800 (1.8%), and Children with disability with moderate core activity limitation: 9,000 (0.2%), and Children with disability with mild core activity limitation: 62,100 (1.3%).
     

Disability groups

What were the most common groups of disability?

Intellectual disability was the most common disability group affecting children in 2018. Around one in twenty two children had intellectual disability (4.5% or 208,800), followed by sensory and speech disability (3.1% or 146,800) and psychosocial disability (2.7% or 127,200). 

  1. Living in households
  2. Children can be classified into more than one disability group
  3. Other' includes limitations, restrictions or impairments reported by the respondent which fall outside the standard disability types as classified in the SDAC, however restricts everyday activities and has lasted, or is expected to last, for at least 6 months

Definitions:

For more information on the terms used, refer to ‘Appendix 2 – Disability Groups’ associated with this publication.

​​​​​​​How did disability groups vary by age and sex?

The groups of disability that affected children varied somewhat with age and sex. It is important to note, however, that the diagnosis of mental disorders in younger children can be very complex. Often children do not receive a formal diagnosis until they reach school age.

Boys aged 0 to 14 years were twice as likely as girls of the same age to report sensory and speech disability (4.2% or 101,100 compared with 2.1% or 47,300) and almost twice as likely to report intellectual disability (5.8% or 137,800 compared with 3.1% or 70,600).

Older children were more likely than younger children to report intellectual and psychosocial disabilities. In 2018, 6.1% (189,200) of children aged 5-14 years with disability had an intellectual disability, over five times the proportion of children aged 0-4 years (1.1% or 17,800).

Similarly, 3.7% of children aged 5-14 years (115,900) reported psychosocial disability, over four times the proportion of the 0-4 year age group (0.8% or 12,600).

Physical disabilities were also more commonly reported by older children aged 5-14 (2.1% or 65,300) than younger children aged 0-4 (1.0% or 15,100).

  1. Living in households
  2. Children can be classified into more than one disability group
     

Long-term health conditions of children with disability

Children may experience a variety of long-term health conditions, including multiple conditions coexisting, though only some of these conditions will have a disabling impact. In 2018, three quarters (74.0% or 264,700) of children under 15 with disability reported a mental and behavioural disorder, and just over half reported a physical condition (52.7% or 188,400). 

Of all children with disability, boys were more likely than girls to report mental and behavioural disorders (77.0% or 177,200 boys compared with 68.3% or 87,900 girls) while girls were more likely to report physical conditions (59.0% or 75,900 girls compared with 48.2% or 110,800 boys). 

  1. Living in households
  2. Conditions which have lasted, or are expected to last, six months or more
  3. Children can be classified into more than one group of conditions
     

What types of conditions were most common?

The long-term health conditions most commonly reported amongst children with disability were autism and related disorders which affected one quarter of all children with disability (26.8% or 95,800), asthma (16.5% or 59,100) and attention deficit disorder/hyperactivity which both affected around one in six children with disability (15% or 53,800). The proportion of children with disability who reported phobic and anxiety disorders increased from 9.4% (30,900) in 2015 to 13.7% (49,000) in 2018. Overall, there were no other significant changes in the proportion of children reporting selected conditions between 2015 and 2018.

Definitions:

Long-term health condition - a disease or disorder that has lasted, or is likely to last, for six months or more. The SDAC collects information about long-term health conditions and through a series of screening questions, determines whether they restrict a person’s ability to do activities. People whose long-term conditions limit their activities are identified as having disability.

Need for and receipt of assistance

How many children with disability needed assistance?

In 2018, three quarters of children with disability had a need for assistance with at least one activity (73.9% or 264,300). Children with disability were most likely to need assistance with cognitive or emotional activities (59.3% or 212,000), followed by communication (38.2% or 136,700), mobility (36.1% or 128,900), self-care (32.0% or 114,300) and health care (27.9% or 99,800).

Overall, boys were more likely than girls to need assistance with self-care activities (35.1% or 80,700 compared with 25.2% or 32,400) and cognitive or emotional activities (64.9% or 149,400 compared with 49.0% or 63,100).

  1. Living in households
  2. Proportions may sum to more than 100% as respondents could report needing assistance with more than one activity
  3. Children aged 5 years and over
     

How many children received assistance?

Of the 264,300 children aged 0-14 with disability who needed assistance with at least one activity, almost all were receiving some form of assistance (97.2% or 256,800).

Children with disability who needed assistance were most likely to receive help with cognitive or emotional tasks (77.4% or 204,700) while almost half received assistance with communication (48.1% or 127,200) and mobility (45.3% or 119,600)
 

Schooling

Regardless of where their education is received, children with disability have a right to the same educational opportunities as all Australian children. In 2018, among school aged children (5 to 14 years) with disability, almost all (95.8% or 285,500) attended school. Of these, nearly one third attended special classes or special schools (31.2% or 89,000).

What types of difficulty were experienced at school?

Four out of every five children with disability attending school (aged 5-14 years) had an educational restriction (83.0% or 151,700 compared with 76.4% or 79,500).

Two thirds of children with disability and attending school experienced difficulties at school (66.5% or 190,000). Nearly half reported learning difficulties (48.7% or 138,900) and over one third had difficulties fitting in socially (38.8% or 110,900). Boys were more likely than girls to have communication difficulties (35.2% or 64,400 compared with 21.1% or 21,900).

  1. Living in households
  2. Children can report more than one difficulty
     

What supports are available?

There are a range of different support and assistance options available for school children with disability. In 2018, over half of all children with disability who attended school accessed a support or special arrangement (58.6% or 167,400). Around one third accessed special tuition (36.8% or 105,200) while around one quarter accessed a counsellor or special support person (23.2% or 66,100).

Of those children who received support or special arrangements, over one third (36.1% or 60,500) reported that they needed more support.

  1. Living in households
  2. Children can have accessed more than one support
     

Impact of caring on parents

In 2018, there were 136,000 primary carers who were caring for their own child aged 0 to 14 years with a profound or severe core activity limitation. While there are a range of organised services available to assist a person in their caring role, the satisfaction with these services varied among carers, as did the impact of the many costs and effects of their caring role on the whole family.

Were parent carers satisfied with available supports?

One in five parent primary carers were dissatisfied with the range of organised services available to assist them with caring for their child (19.1% or 26,000) while 32.9% (44,800) were satisfied and a further 22.8% were neither satisfied or dissatisfied (31,000).

Nearly three in five (57.4% or 78,100) parent primary carers reported that they needed an improvement or more support to assist them in their caring role, an increase from 46.4% (54,700) in 2015.

  1. Living in households
     

What are the main impacts of the caring role?

Among parent primary carers, the effect of their caring role on family relationships varied:

  • around one in four with a spouse or partner reported their relationship with them was unaffected (24.2% or 25,900), while 21.1% (22,600) reported relationship strain
  • around one in four reported a lack of alone time together with their spouse (23.2% or 24,900).
  • one quarter reported their relationships with other co-resident family members were unaffected (25.2% or 34,300), while one third reported the main effect of their caring role was having less time to spend with other co-resident family members (34.0% or 46,200).
     

One third of parent primary carers reported that the main financial impact of their caring role was a decreased income (37.7% or 51,300) and another one third reported an increase in their expenses (35.3% or 48,000).

Almost half of parent primary carers who were employed (45.5% or 35,800) said they had reduced the weekly hours they worked in all jobs since commencing the caring role.

  1. Living in households
  2. Parent primary carers with a spouse or partner

Results relating to 2015 data can be found in the 2015 Survey of Disability, Ageing and Carers (ABS cat. No. 4430.0)

Definitions:

Primary carer - a person aged 15 years and over who provides the most informal assistance to a person with disability for the core activities of mobility, self-care and communication

Post release changes

Show all

10/05/2023 – An amendment was made to dot point 2 in the Carers subsection to remove the reference to people aged 15 years and over and reflect the correct denominator for the population (all persons).

11/06/2021 - Aboriginal and Torres Strait Islander people with disability: This article uses results from the 2018 Survey of Disability, Ageing and Carers (SDAC) to present analysis of disability prevalence among Aboriginal and Torres Strait Islander people within the scope of the survey. Commentary includes analysis of severity and type of disability, assistance needed and received due to disability, education, employment, income, and discrimination. Along with the commentary, this release includes a data cube.

28/09/20 - Psychosocial disability: the psychological disability data cube on the data downloads page of the Psychosocial disability article was updated to include an additional footnote (Tables 5 and 6), and to correct an error in the data (Table 5 row 13).

25/09/2020-Psychosocial disability: This article uses results from the 2018 Survey of Disability, Ageing and Carers (SDAC) to present analysis on the prevalence of psychosocial disability in Australia including information around demographic characteristics, need for and receipt of assistance, education, employment, income and experience of discrimination. Along with the commentary, this release includes two data cubes - one containing psychosocial disability data and the other psychological disability data (for time series purposes).

10/09/2020 Small area estimates: Two data cubes containing modelled small area estimates for persons with disability and carers by age and sex for Statistical Areas Level 2 (SA2) of usual residence and Local Government Areas have been added to the Data downloads section. A section in the Methodology has also been added, providing summary information about how these small area estimates were modelled. For full details email disability.statistics@abs.gov.au for a copy of the 2018 SDAC Small Area Estimates Explanatory Notes PDF.

31/07/2020 - Dementia: This article uses results from the 2018 Survey of Disability, Ageing and Carers (SDAC), to present an analysis on people living with dementia in Australia. Commentary includes analysis of prevalence and severity of dementia, and assistance needed and received for dementia. Along with the commentary, this release includes a data cube.

24/07/2020 - Disability and the Labour Force: This article uses results from the 2018 Survey of Disability, Ageing and Carers (SDAC), to present an analysis on labour force participation of people with disability. Commentary includes participation by disability severity and group, employment restrictions and experiences of discrimination in the workplace. Along with the commentary, this release includes a data cube.

21/07/2020 - Use of technology by people with disability, older people and primary carers: This article uses 2018 Survey of Disability, Ageing and Carers (SDAC) data to present analysis of the use of information technology by these three groups, including use of the Internet, SMS/text message, email and social networking/chat rooms, as well as reasons they were not used. Along with the commentary, this release includes a data cube which is available from the Data downloads section.

05/02/2020 - State and Territory data cubes are available from the Data downloads section.

10/12/2019 - Children with Disability: This article uses results from the 2018 Survey of Disability, Ageing and Carers (SDAC), to present an analysis on children with disability including the prevalence of disability among children aged 0-14 years, and the types of disability most common among children. Along with the analysis, this release includes a data cube which is available from the Data downloads section.

29/11/2019 - Autism in Australia: This article uses results from the 2018 Survey of Disability, Ageing and Carers (SDAC), to present an updated analysis of the prevalence of autism in Australia, and the impact the condition has on those living with Autism. Along with the analysis, this release includes a data cube which is available from the Data downloads section.

04/11/2019 - The Data Item List has been replaced to correct a column label in the 'Transport - Private' tab. A link in the Quality Declaration has been updated.

Data downloads

Disability tables

Older people tables

Carers tables

New South Wales

Released 05/02/2020

Victoria

Released 05/02/2020

Queensland

Released 05/02/2020

South Australia

Released 05/02/2020

Western Australia

Released 05/02/2020

Tasmania

Released 05/02/2020

Australian Capital Territory

Released 05/02/2020

Data item list

Released 04/11/2019

Long term health conditions ICD-10

Autism in Australia

Released 29/11/2019

Children with disability

Released 10/12/2019

Use of information technology

Released 21/07/2020

Disability and the labour force

Released 24/07/2020

Dementia in Australia

Released 31/07/2020

2018 SDAC SA2 modelled estimates

Released 10/09/2020

2018 SDAC LGA modelled estimates

Released 10/09/2020

All data cubes

Survey material

4430.0 - Household questionnaire

Prompt cards for household questionnaire

To view the Cared-accommodation Questionnaire click here

Previous catalogue number

This release previously used catalogue number 4430.0

Back to top of the page