STATE FINAL DEMAND
State final demand measures the total value of goods and services that are sold in a state to buyers who wish to either consume them or retain them in the form of capital assets. It excludes sales made to buyers who use them as inputs to a production activity, export sales and sales that lead to accumulation of inventories.
Measures of state final demand make no distinction between demand that is met by goods and services produced within the state in question, by supplies sourced from another state, or from overseas. State final demand is therefore not a measure of the value of production activity occurring within a state.
Note: As of 20 November 2006, the Telstra Corporation was effectively privatised. For the purpose of ABS statistics this change from public to private sector is effective from March quarter 2007. The classification of Telstra has changed from public sector to non-financial corporation from the March quarter 2007. There is a trend break from March quarter 2007 in a number of series related to the privatisation of Telstra. As a result no trend estimates are published for these series. For more information please see Information Paper: Treatment of Telstra in ABS statistics (cat. no. 8102.0) released 26 February 2007.
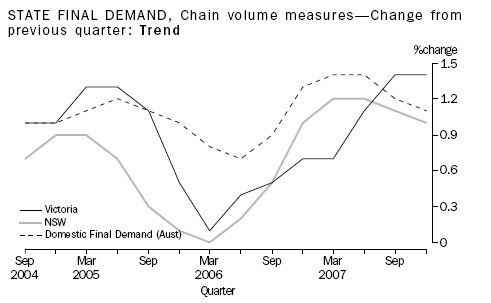
For the December quarter 2007, the trend estimate for Victorian final demand, in volume terms, was $63,851m, an increase of 1.4% on the September quarter 2007. This was above both the trend growth level for New South Wales (1.0%) and the Australian trend estimate (1.1% domestic final demand) over the same period.
Household final consumption expenditure is the single largest component of state final demand. In December quarter 2007, this component accounted for 58.3% of the trend volume estimate of state final demand and recorded an increase of 1.3% on the September quarter 2007. The other main contributors were private gross fixed capital formation (22.5% of trend state final demand) and government final consumption expenditure (16.6%).

View underlying table as an Excel spreadsheet: 1367.2
Table 13, State Final Demand, Seasonally Adjusted and Trend (file size 15kB).
View underlying table as an Excel spreadsheet:
1367.2 Table 14, State Final Demand, Original (file size 14kB).
 Print Page
 Print All