GOVERNMENT FUNDING
In 2005-06, government funding for cultural activities totalled $5,449.7m, with state and territory governments providing almost half (48% or $2,598.1m), the Australian Government contributing 35% ($1,878.4m), and local government making up the balance of 18% ($973.2m).
Funding for capital expenditure accounted for 12% of cultural funding by all levels of government, while recurrent expenditure accounted for the remaining 88%.
Apart from direct funding, the Australian Government also provides assistance through tax concessions such as the Cultural Gifts Program, which offers tax deductions to encourage the donation of items of cultural significance to public art galleries, museums and libraries.
According to the Department of Communications, Information Technology and the Arts (DCITA) Annual Report for 2005-06, 615 donations were made to the program in that year with a total value of $28.9m.
In 2005-06, the majority of Australian Government cultural funding supported Arts activities ($1,406.2m or 75% of total Australian Government funding). Broadcasting and film was the main beneficiary receiving over half of the total funding provided ($1,141.3m or 61%).
In contrast, state and territory governments directed the majority of their funding to Heritage activities ($2,142.1m or 82%) in 2005-06. Nature parks and reserves received $1,016.3m representing 39% of the total state and territory government funding for cultural activities.
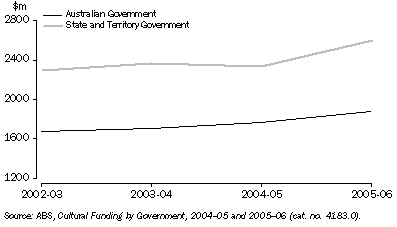
The Australian Government and state and territory governments increased their funding of cultural activities over the period 2002-03 to 2005-06. Australian Government funding increased by 12.4% and state and territory government funding increased by 13.3%. Local government funding of cultural activities increased by 8.4% over the period 2004-05 to 2005-06.
4.2 CULTURAL FUNDING, 2002-03 to 2005-06
 Print Page
 Print All