QUEENSLAND
Fastest and largest projected household growth in Australia
Between 2006 and 2031, Queensland is projected to experience the fastest household growth of the states and territories, increasing by between 68% and 75%, reflecting the high population growth projected for the state. Queensland's population is projected to grow by 59% between 2006 and 2031, from 4.1 million to 6.5 million, compared to Australia's projected growth of 39%.
As a result, Queensland is projected to experience the largest numeric increase in households of all the states and territories, increasing by between 1.0 and 1.1 million households to reach between 2.5 and 2.6 million households in 2031, from 1.5 million in 2006. Queensland's growth is projected to account for 28% of the total increase in households in Australia between 2006 and 2031.
Growth in the number of lone person households in Queensland is projected to be the most rapid of all the states and territories, increasing between 89% and 124% (from 334,400 households in 2006 to between 630,800 and 747,600 in 2031). The number of women living alone is projected to more than double, increasing by between 101% and 119% (from 177,000 in 2006 to between 355,900 and 386,800 in 2031). Over the same period, the number of men living alone in Queensland is projected to increase by between 75% and 129% (from 157,500 in 2006 to between 275,000 and 360,800 in 2031).
4.10 Projected number of households, Household type - Queensland |
|
 | As at 30 June |
| 2006 | 2011 | 2016 | 2021 | 2026 | 2031 |
| Household type | '000 | '000 | '000 | '000 | '000 | '000 |
SERIES I |
|
| Family households | 1 113.3 | 1 248.9 | 1 393.0 | 1 538.0 | 1 678.7 | 1 814.5 |
| Group households | 65.3 | 73.0 | 80.4 | 86.6 | 92.6 | 99.4 |
| Lone person households | 334.4 | 384.1 | 440.2 | 501.5 | 565.8 | 630.8 |
| Total | 1 513.0 | 1 706.0 | 1 913.7 | 2 126.1 | 2 337.1 | 2 544.7 |
SERIES II |
|
| Family households | 1 113.3 | 1 243.6 | 1 385.0 | 1 529.2 | 1 671.0 | 1 808.0 |
| Group households | 65.3 | 73.5 | 81.3 | 87.8 | 93.9 | 100.8 |
| Lone person households | 334.4 | 402.5 | 469.8 | 538.1 | 604.9 | 673.2 |
| Total | 1 513.0 | 1 719.6 | 1 936.1 | 2 155.1 | 2 369.8 | 2 582.0 |
SERIES III |
|
| Family households | 1 113.3 | 1 243.6 | 1 382.5 | 1 523.4 | 1 662.0 | 1 797.2 |
| Group households | 65.3 | 73.5 | 81.5 | 88.0 | 93.8 | 100.1 |
| Lone person households | 334.4 | 402.5 | 479.3 | 563.3 | 653.0 | 747.6 |
| Total | 1 513.0 | 1 719.6 | 1 943.3 | 2 174.8 | 2 408.9 | 2 644.9 |
|
Average household size
Average household size in Queensland is projected to decline from 2.7 people per household in 2006 to between 2.4 and 2.5, the same as the average household size projected for Australia in 2031.
Growth in number of families
The number of families in Queensland is projected to increase more rapidly than families Australia-wide. From 1.1 million in 2006, families in Queensland are projected to increase to between 1.8 million and 1.9 million in 2031, an increase of between 61% and 63%.
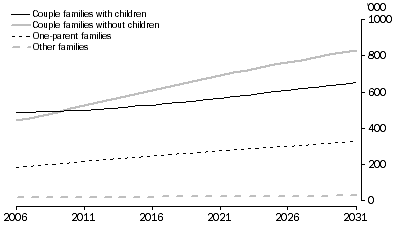
In 2006, couple families with children were the most common family type in Queensland, with 487,500 families accounting for 43% of all families. While this family type is projected to grow in all three series, it is projected to experience a decline as a proportion of all families. The number of couple families with children is projected to increase to between 517,800 and 733,700 families, representing between 28% and 40% of all families in Queensland by 2031.
In all three series, couple families
without children are projected to become the most common family type in Queensland. This family type is projected to increase by between 78% and 102% between 2006 and 2031, from 443,100 to between 789,300 and 893,200, overtaking couple families
with children as the most common family type in 2016 (in Series I) or 2010 (in Series II and III). For Australia, the number of couple families
without children is projected to increase by between 57% and 77% over the same period.
One-parent families in Queensland are projected to increase at a faster rate than couple families with children, increasing by between 60% and 112% over the projection period, from 184,900 in 2006 to between 295,400 and 391,900 in 2031. As with other family types, one-parent families are projected to increase more rapidly in Queensland than nationally, where this family type is projected to grow by between 40% and 77% over the same period.
4.11 Projected families, Family type - Queensland - Series II
4.12 Projected number of families, Family type - Queensland |
|
| | As at 30 June |
| | 2006 | 2011 | 2016 | 2021 | 2026 | 2031 |
| Family type | '000 | '000 | '000 | '000 | '000 | '000 |
SERIES I |
|
| Couple families with children | 487.5 | 534.9 | 584.6 | 635.4 | 685.7 | 733.7 |
| Couple families without children | 443.1 | 511.3 | 584.8 | 657.3 | 725.1 | 789.3 |
| One-parent families | 184.9 | 205.2 | 226.5 | 248.7 | 271.8 | 295.4 |
| Male parent | 31.4 | 35.1 | 38.9 | 42.7 | 46.9 | 51.2 |
| Female parent | 153.5 | 170.1 | 187.7 | 206.0 | 225.0 | 244.3 |
| Other families | 19.8 | 22.3 | 24.7 | 27.0 | 29.4 | 32.0 |
| Total | 1 135.3 | 1 273.7 | 1 420.6 | 1 568.5 | 1 711.9 | 1 850.4 |
SERIES II |
|
| Couple families with children | 487.5 | 501.0 | 529.1 | 565.5 | 611.1 | 654.7 |
| Couple families without children | 443.1 | 527.6 | 612.0 | 693.1 | 765.2 | 833.2 |
| One-parent families | 184.9 | 218.9 | 248.8 | 276.9 | 302.2 | 328.4 |
| Male parent | 31.4 | 37.1 | 42.1 | 46.9 | 51.3 | 56.0 |
| Female parent | 153.5 | 181.8 | 206.7 | 230.0 | 250.9 | 272.3 |
| Other families | 19.8 | 20.7 | 22.5 | 24.0 | 25.6 | 27.5 |
| Total | 1 135.3 | 1 268.2 | 1 412.4 | 1 559.5 | 1 704.1 | 1 843.8 |
SERIES III |
|
| Couple families with children | 487.5 | 501.0 | 510.9 | 517.3 | 519.9 | 517.8 |
| Couple families without children | 443.1 | 527.6 | 620.1 | 714.4 | 805.5 | 893.2 |
| One-parent families | 184.9 | 218.9 | 256.3 | 297.5 | 342.7 | 391.9 |
| Male parent | 31.4 | 37.1 | 43.2 | 49.8 | 57.1 | 65.0 |
| Female parent | 153.5 | 181.8 | 213.2 | 247.7 | 285.6 | 326.9 |
| Other families | 19.8 | 20.7 | 22.5 | 24.4 | 26.8 | 30.0 |
| Total | 1 135.3 | 1 268.2 | 1 409.8 | 1 553.6 | 1 694.9 | 1 832.8 |
|
Living arrangements in Queensland
4.13 Projected number of persons, Living arrangement - Queensland |
|
| | | As at 30 June |
| | | 2006 | 2011 | 2016 | 2021 | 2026 | 2031 |
| Living arrangement | '000 | '000 | '000 | '000 | '000 | '000 |
SERIES I |
|
| Family households | | | | | | |
| Couple families with children | | | | | | |
| | Husband, wife or partner | 975.0 | 1 069.8 | 1 169.1 | 1 270.8 | 1 371.3 | 1 467.3 |
| | Child | 1 027.3 | 1 120.9 | 1 211.9 | 1 301.8 | 1 390.6 | 1 472.7 |
| | Other related individual | 19.8 | 22.7 | 26.0 | 29.6 | 33.6 | 37.6 |
| Couple families without children | | | | | | |
| | Husband, wife or partner | 886.3 | 1 022.6 | 1 169.5 | 1 314.6 | 1 450.1 | 1 578.6 |
| | Other related individual | 14.6 | 16.8 | 19.0 | 21.5 | 24.6 | 28.4 |
| One-parent families | | | | | | |
| | Male parent | 31.4 | 35.1 | 38.9 | 42.7 | 46.9 | 51.2 |
| | Female parent | 153.5 | 170.1 | 187.7 | 206.0 | 225.0 | 244.3 |
| | Child | 311.8 | 340.0 | 367.7 | 395.7 | 423.5 | 449.2 |
| | Other related individual | 16.3 | 18.5 | 20.9 | 23.3 | 25.8 | 28.3 |
| Other families | | | | | | |
| | Related person living in an other family | 41.6 | 46.8 | 52.0 | 56.8 | 61.8 | 67.2 |
| Total(a) | 3 529.2 | 3 920.7 | 4 325.0 | 4 729.4 | 5 124.1 | 5 501.0 |
| Group households | | | | | | |
| Group household member | 150.6 | 168.2 | 185.3 | 199.6 | 213.4 | 229.2 |
| Lone person households | | | | | | |
| Male lone person | 157.5 | 178.9 | 202.3 | 226.5 | 250.8 | 275.0 |
| Female lone person | 177.0 | 205.2 | 237.9 | 274.9 | 315.0 | 355.9 |
| Usual resident of a non-private dwelling | 76.7 | 89.2 | 101.9 | 115.9 | 134.7 | 158.2 |
| Total | 4 090.9 | 4 562.2 | 5 052.4 | 5 546.5 | 6 038.0 | 6 519.1 |
SERIES II |
|
| Family households | | | | | | |
| Couple families with children | | | | | | |
| | Husband, wife or partner | 975.0 | 1 002.0 | 1 058.1 | 1 131.0 | 1 222.1 | 1 309.4 |
| | Child | 1 027.3 | 1 099.3 | 1 175.9 | 1 256.1 | 1 341.7 | 1 420.8 |
| | Other related individual | 19.8 | 18.0 | 18.1 | 19.2 | 21.5 | 23.8 |
| Couple families without children | | | | | | |
| | Husband, wife or partner | 886.3 | 1 055.3 | 1 224.1 | 1 386.2 | 1 530.3 | 1 666.4 |
| | Other related individual | 14.6 | 15.9 | 17.4 | 19.1 | 21.6 | 24.7 |
| One-parent families | | | | | | |
| | Male parent | 31.4 | 37.1 | 42.1 | 46.9 | 51.3 | 56.0 |
| | Female parent | 153.5 | 181.8 | 206.7 | 230.0 | 250.9 | 272.3 |
| | Child | 311.8 | 371.6 | 419.6 | 461.5 | 493.9 | 523.9 |
| | Other related individual | 16.3 | 19.5 | 22.5 | 25.3 | 28.0 | 30.6 |
| Other families | | | | | | |
| | Related person living in an other family | 41.6 | 43.4 | 47.3 | 50.5 | 53.9 | 57.8 |
| Total(a) | 3 529.2 | 3 905.5 | 4 301.2 | 4 701.2 | 5 095.6 | 5 471.9 |
| Group households | | | | | | |
| Group household member | 150.6 | 169.5 | 187.5 | 202.4 | 216.4 | 232.3 |
| Lone person households | | | | | | |
| Male lone person | 157.5 | 191.0 | 222.4 | 252.4 | 279.2 | 305.8 |
| Female lone person | 177.0 | 211.5 | 247.4 | 285.6 | 325.7 | 367.4 |
| Usual resident of a non-private dwelling | 76.7 | 84.7 | 93.9 | 104.8 | 121.1 | 141.8 |
| Total | 4 090.9 | 4 562.2 | 5 052.4 | 5 546.5 | 6 038.0 | 6 519.1 |
SERIES III |
|
| Family households | | | | | | |
| Couple families with children | | | | | | |
| | Husband, wife or partner | 975.0 | 1 002.0 | 1 021.8 | 1 034.6 | 1 039.9 | 1 035.5 |
| | Child | 1 027.3 | 1 099.3 | 1 162.7 | 1 218.6 | 1 266.3 | 1 301.2 |
| | Other related individual | 19.8 | 18.0 | 16.1 | 14.2 | 12.8 | 11.6 |
| Couple families without children | | | | | | |
| | Husband, wife or partner | 886.3 | 1 055.3 | 1 240.2 | 1 428.8 | 1 611.0 | 1 786.3 |
| | Other related individual | 14.6 | 15.9 | 17.0 | 18.1 | 19.7 | 21.7 |
| One-parent families | | | | | | |
| | Male parent | 31.4 | 37.1 | 43.2 | 49.8 | 57.1 | 65.0 |
| | Female parent | 153.5 | 181.8 | 213.2 | 247.7 | 285.6 | 326.9 |
| | Child | 311.8 | 371.6 | 437.8 | 511.8 | 592.8 | 677.9 |
| | Other related individual | 16.3 | 19.5 | 23.0 | 26.8 | 30.7 | 34.7 |
| Other families | | | | | | |
| | Related person living in an other family | 41.6 | 43.4 | 47.2 | 51.2 | 56.3 | 62.9 |
| Total(a) | 3 529.2 | 3 905.5 | 4 294.0 | 4 683.3 | 5 064.3 | 5 427.7 |
| Group households | | | | | | |
| Group household member | 150.6 | 169.5 | 187.9 | 202.9 | 216.3 | 230.8 |
| Lone person households | | | | | | |
| Male lone person | 157.5 | 191.0 | 229.0 | 270.5 | 314.6 | 360.8 |
| Female lone person | 177.0 | 211.5 | 250.4 | 292.9 | 338.4 | 386.8 |
| Usual resident of a non-private dwelling | 76.7 | 84.7 | 91.2 | 96.9 | 104.3 | 113.0 |
| Total | 4 090.9 | 4 562.2 | 5 052.4 | 5 546.5 | 6 038.0 | 6 519.1 |
|
| (a) Includes unrelated individuals in family households. |
 Quality Declaration
  Print Page
 Print All