UNEMPLOYED PEOPLE
In the LFS, people are considered to be unemployed if they satisfy three criteria: they are not employed; they are available for work; and they are taking active steps to find work.
Two important measures of unemployment are the number of people unemployed and the unemployment rate. The unemployment rate, defined as the number of unemployed people expressed as a percentage of the labour force, offers an insight into the degree of slack in the labour market.
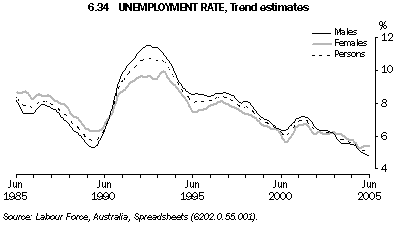
Movements in the unemployment rate over the past 20 years are dominated by the economic downturns of the early-1980s and early-1990s, and the subsequent periods of economic recovery (graph 6.34). In trend terms, the unemployment rate peaked at 10.7% in December 1992, then generally fell over the rest of the 1990s and early-2000s, and was 5.1% in June 2005.
Prior to 1990, the unemployment rate for men was lower than for women. However, as the unemployment rate increased sharply in 1990-91, the male unemployment rate increased to a level above the female unemployment rate. Since May 2003, this has reversed and the female unemployment rate has been slightly higher than the male unemployment rate.
As graph 6.35 shows, the number of unemployed people has generally declined from the levels recorded in the early-1990s. For the unemployed seeking full-time work, the trend has generally reflected the overall impact of the economic cycle. In contrast, over the past two decades, the trend for those seeking part-time work has generally increased steadily, rising from 97,600 people (or 16% of unemployed people) in June 1985 to 159,000 people (or 30% of unemployed people) in June 2005.
In recent years the proportion of the unemployed who had experienced unemployment for less than 26 weeks has been rising steadily, while the proportion who experienced unemployment for 52 weeks and over (long-term unemployment) has been in decline. In 2004-05, 69% of unemployed people had been unemployed for less than 26 weeks, while the long-term unemployed made up 19% of unemployed people (table 6.36).
6.36 UNEMPLOYED PERSONS(a), By duration of unemployment
|
| Weeks | Units | 2001-02 | 2002-03 | 2003-04 | 2004-05 |
|
| Under 8 | % | 35.8 | 37.0 | 38.6 | 43.0 |
| 8 to under 26 | % | 28.0 | 27.7 | 26.9 | 25.7 |
| Under 26 | % | 63.8 | 64.7 | 65.5 | 68.6 |
| 26 to under 52 | % | 14.1 | 13.7 | 13.5 | 12.4 |
| 52 to under 104 | % | 8.8 | 8.9 | 9.0 | 7.9 |
| 104 and over | % | 13.3 | 12.8 | 12.0 | 11.2 |
| 52 and over | % | 22.1 | 21.6 | 21.0 | 19.0 |
| Total | % | 100.0 | 100.0 | 100.0 | 100.0 |
| Persons | '000 | 663.3 | 624.4 | 586.0 | 545.6 |
|
(a) Annual averages.
Source: Labour Force, Australia, Detailed - Electronic Delivery (6291.0.55.001). |
Educational qualifications have a significant bearing on labour market prospects. Table 6.37 shows the relationship between the level of highest educational attainment and duration of unemployment. Of unemployed people with a bachelor degree or above in July 2004, 14% were long-term unemployed, compared with 22% of those whose highest educational attainment was Year 12 or below.
6.37 UNEMPLOYED PERSONS, Educational attainment and duration of unemployment - July 2004
|
 | Duration of current period of unemployment (weeks) | | |
|
| | |
| Under 8 | 8 to
under 26 | 26 to
under 52 | 52 to
under 104 | 104 and
over | Total | Number |
| Level of highest educational attainment(a) | % | % | % | % | % | % | '000 |
|
| Bachelor degree or above | 44.4 | 32.5 | 9.5 | *6.0 | *7.6 | 100.0 | 59.0 |
| Advanced diploma or diploma | 38.6 | 31.4 | *11.6 | *8.7 | *9.8 | 100.0 | 26.6 |
| Certificate III / IV | 35.9 | 25.8 | 13.9 | 10.2 | 14.1 | 100.0 | 55.5 |
| Certificate I / II(b) | *32.6 | *22.6 | **4.6 | *14.4 | *25.8 | 100.0 | 10.4 |
| Year 12 or below | 32.6 | 29.1 | 16.3 | 7.3 | 14.7 | 100.0 | 370.9 |
| Level not determined | *51.5 | **15.5 | *23.3 | **9.7 | - | 100.0 | 5.4 |
| Total(c) | 34.7 | 29.0 | 14.9 | 7.7 | 13.7 | 100.0 | 528.2 |
|
(a) The levels of education are not necessarily listed in order from highest to lowest. For further details on how level of highest educational attainment is determined see 'Education and work, Australia' (6227.0).
(b) Includes 'Certificate not further defined'.
(c) Includes no educational attainment.
Source: Job Search Experience, Australia, July 2004 (6222.0). |
Unemployed people encounter a variety of difficulties in finding work. In July 2004, men and women reported most of the more common difficulties in largely similar proportions (graph 6.38). However, women were more likely to report insufficient work experience as their main difficulty (15% compared with 12% for men), as well as difficulties that relate to concerns outside of the workplace, such as 'Unsuitable hours' (8% compared with 4%) and 'Difficulties with child care, other family responsibilities' (5% compared with 2%). Men were more likely to report their main difficulty as being 'Considered too old by employers' (12% compared with 10% for women) and 'No vacancies in line of work' (10% compared with 5%).
 Print Page