Special Article - Indigenous populations of Australia and New Zealand
The indigenous populations of Australia and New Zealand make up only a small proportion of each country's population. Comparison of these two populations is assisted by the Australian Bureau of Statistics (ABS) and Statistics New Zealand using similar approaches to identifying their indigenous populations.
POPULATION SIZE
In June 1999 Australia's Aboriginal and Torres Strait Islander population was projected to be 418,800 persons while New Zealand's Maori population numbered 598,800 persons. In 1999 the Maori population represented 16% of the total New Zealand population while the Aboriginal and Torres Strait Islander population represented only 2% of Australia's population. The Maori population have a greater impact on the dynamics of New Zealand's population than does the Aboriginal and Torres Strait Islander population on Australia's population.
AGE STRUCTURE
The indigenous populations of both countries have a considerably younger age structure than that of the total population, resulting from their higher fertility and mortality rates. In 2000, 39% of the Aboriginal and Torres Strait Islander population and 37% of the Maori population were aged under 15 years (compared with 20% and 23% of all people in Australia and New Zealand, respectively). As a consequence the indigenous population of both countries had low median ages - 20 years for Australian indigenous and 21 years for New Zealand indigenous. The comparative median ages for the total populations were 35 years for Australia and 34 years for New Zealand.
RECENT POPULATION CHARACTERISTICS
|
 |  |  | AUSTRALIA |  | NEW ZEALAND |
 |  |  |
|  |
|
 |  |  | Total | Indigenous |  | Total | Indigenous |
|
| Population ('000) | June 2000 |  | 19,157.1 | 418.8 |  | 3,830.8 | 598.8 |
| 0-14 years (%) | June 2000 |  | 20.5 | 39.0 |  | 22.9 | 36.5 |
| 15-64 years (%) | June 2000 |  | 67.2 | 58.5 |  | 65.3 | 60.2 |
| 65 years and over (%) | June 2000 |  | 12.3 | 2.5 |  | 11.8 | 3.3 |
| Median age (years) | June 2000 |  | 35.2 | 20.2 |  | 34.3 | 21.3 |
| Population growth (%) |  |  |  |  |  |  |  |
| 1999-2000 (%) | June 2000 |  | 1.2 | 2.0 |  | 0.5 | 2.2 |
| 1992-2000 (average annual %) | June 2000 |  | 1.1 | 2.2 |  | 1.1 | 2.3 |
| Total fertility rate (babies per woman) | 1999 |  | 1.7 | 2.1 |  | 2.0 | 2.6 |
| Life expectancy(a) |  |  |  |  |  |  |  |
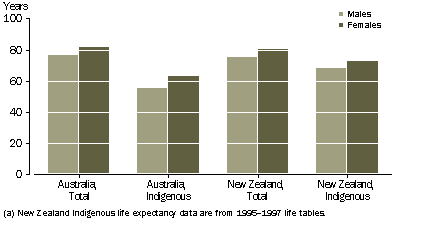
| Males (years) | 1997-1999 |  | 76.2 | 55.6 |  | 75.2 | 68.0 |
| Females (years) | 1997-1999 |  | 81.8 | 63.0 |  | 80.4 | 73.0 |
| Infant mortality rates |  |  |  |  |  |  |  |
| Males | 1999 |  | 6.4 | 15.5 |  | 6.5 | 10.2 |
| Females | 1999 |  | 4.9 | 12.7 |  | 4.5 | 5.9 |
|
(a) New Zealand indigenous life expectancy data are from 1995-1997 life tables.
Sources: Australian Demographic Statistics, March 2001 (Cat. no. 3101.0); Experimental Projections of the Indigenous Population, 1996-2006 (Cat. no. 3231.0); Births, Australia, 1999 (Cat no. 3301.0); Deaths, Australia, 1999 (Cat. no. 3302.0); Statistics New Zealand, Demographic Trends, 2000, Wellington; Statistics New Zealand website.
FERTILITY
Since the early 1960s, the total fertility rates for both Australian and New Zealand women have declined, although the rates for New Zealand have generally been higher than for Australia. This higher level of fertility for New Zealand women can be attributed to the higher proportions of Maori and Pacific Islands women in New Zealand's population.
The fertility patterns of the indigenous populations of Australia and New Zealand show that while indigenous women tend to have more children at younger ages than the non-indigenous population, they too have experienced a decline in fertility over the last 40 years. The total fertility rate of Aboriginal and Torres Strait Islander women fell from about 5.8 babies per woman in the 1960s to 2.1 babies per woman in 1999. Similarly, the total fertility rate for Maori women fell from about 5.8 babies per woman in the 1960s to 2.6 in 1999. These rates need to be interpreted with caution because of the indigenous status identification issues in population censuses and birth registrations and definitional changes that have occurred between 1960 and 1999.
MORTALITY
The life expectancies of indigenous people in both countries are considerably lower than those of the total population. In 1997-1999, Aboriginal and Torres Strait Islander Australians had a life expectancy about 20 years lower than that of the Australian population as a whole. In comparison, the life expectancy of New Zealand Maoris was about 10 years lower than that of the total New Zealand population, based on 1995-1997 life tables.
LIFE EXPECTANCY, 1997-1999(a)

Gains in life expectancy over the last century can be attributed in part to improvements in the infant mortality rate. The infant mortality rate is an indicator of population health and living conditions. The world infant mortality rate was projected to be 57 infant deaths per 1,000 live births for the year 2000. Australia's and New Zealand's rates of 5.7 and 5.6 respectively in 1999, ranked among the lowest in the world. However, the rates for the indigenous populations were notably higher than for the total population of each country. In 1999, the infant mortality rate for Aboriginal and Torres Strait Islanders was 14.1 deaths per 1,000 live births (15.5 for males and 12.7 for females). In the same year, the Maori infant mortality rate was 8.1 deaths per 1,000 live births (10.2 for males and 5.9 for females).
ADDITIONAL INFORMATION
Additional analysis and data are available in the ABS publication Australian Social Trends, 2001 (Cat. no. 4102.0) which was released on 6 June 2001.
 Print Page
 Print All