3218.0 - Regional Population Growth, Australia, 2012-13  Quality Declaration
Quality Declaration ARCHIVED ISSUE Released at 11:30 AM (CANBERRA TIME) 03/04/2014
Page tools:
 Print Page Print Page
 Print All Print All
| ||
|
FEATURE ARTICLE: CAPITAL CITIES: PAST, PRESENT AND FUTURE Introduction How many people live in capital cities? Population growth over the last 40 years Projected population growth over the next 40 years References INTRODUCTION This article looks at population data for Australia's eight capital cities (footnote 1) over the 80 year time period June 1973 to June 2053. In this article, estimated resident population tells the story of growth over the last 40 years, and population projections provide us with an indication of what population levels could be for the next 40 years. HOW MANY PEOPLE LIVE IN CAPITAL CITIES? Two in three Australians live in a capital city. In 1973, 8.8 million Australians (65% of the population) lived in a capital city. By 2013 this number had increased to 15.3 million (66%). 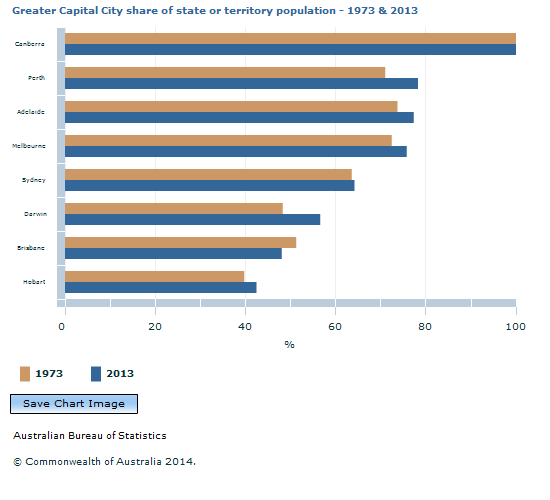 Source(s): Regional Population Growth, Australia (cat. no. 3218.0) Among some states and territories, the proportion of population in capital cities increased over this period. In particular, the proportion of the Northern Territory's population living in Greater Darwin increased from 48% to 57% between 1973 and 2013, and Greater Perth now accounts for 78% of Western Australia's population, up from 71% in 1973. Greater Brisbane was the only capital city to decrease in share of state population over the last 40 years, down from 51% to 48%. This reflects comparatively stronger growth in areas such as the Gold Coast and the Sunshine Coast. In Victoria, Western Australian and South Australia, around three-quarters of the population lived in the capital city in 2013. Tasmania had the highest proportion of population living outside the capital city, at 58%. The only other state with more residents living outside the capital city than in it was Queensland (52%). POPULATION GROWTH OVER THE LAST 40 YEARS Historically the largest two cities in Australia, Sydney and Melbourne were the capital cities that grew by the largest number of people between 1973 and 2013. However, Darwin and Perth were the fastest growing capitals. , Greater Capital Cities - 1973 to 2013.gif) Source(s): Regional Population Growth, Australia (cat. no. 3218.0) , Greater Capital Cities - 1973 to 2013.gif) Source(s): Regional Population Growth, Australia (cat. no. 3218.0) Sydney and Melbourne had the largest growth of all capital cities between 1973 and 2013, both adding around 1.7 million new residents to their populations. Earlier in this period, Sydney grew at a faster overall rate than Melbourne, but since 2000 Melbourne has increased more rapidly. For the total 40 year period, Melbourne increased by 62% while Sydney increased by 54%. Brisbane and Perth have also had large growth, both increasing by around 1.2 million people. This is an increase of 152% for Perth, and 124% for Brisbane. The four largest capitals (Sydney, Melbourne, Brisbane and Perth) had 89% of the total capital city growth between 1973 and 2013. In 2013, 87% of all capital city residents lived in these cities. However, Darwin had the fastest growth of all capital cities, increasing by 191% since 1973. Perth (up by 152%), Brisbane (124%) and Canberra (120%) were the only other capitals where population more than doubled. In more recent years, Perth has been the capital with the strongest growth. Between 2012 and 2013, Perth grew by 3.5%, followed by Darwin (3.0%), Melbourne (2.2%) and Brisbane (2.1%). PROJECTED POPULATION GROWTH OVER THE NEXT 40 YEARS Population projections are not predictions or forecasts, but are illustrations of the change in population which would occur if certain assumptions about future levels of fertility, mortality and migration (usually based on recent trends) were to hold over time. This article outlines projections using Series B, one of a number of possible combinations of the various assumptions. Series B largely reflects recent trends which indicate increasing levels of fertility and net overseas migration for Australia, and life expectancy at birth (footnote 2). Projections show a further concentration of Australia's population within the capital cities. Series B shows the proportion of people living in a capital city is projected to increase from 66% in 2013 to 72% in 2053. In 2053, 89% capital city residents will live in the four largest capital cities. The two graphs below show the population growth of the eight capital cities over the past 40 years as well as projected growth for the next 40 years.  population, larger Greater Capital Cities - 1973 to 2053.gif) Footnote(s): (a) Projections based on Series B. Source(s): Regional Population Growth, Australia (cat. no. 3218.0), Population Projections, Australia, 2012 (base) to 2101 (cat. no. 3222.0) Between 2000 and 2013, Melbourne has grown faster than Sydney. In Series B, Melbourne's population is projected to reach that of Sydney around 2053, when both are projected to have populations of just under 8 million. Some projection series suggest Melbourne's population will reach and then overtake Sydney's earlier than this, while other series project Sydney will still have a higher population in 2053. Perth's population overtook that of Adelaide in 1984, and given current high growth rates, Series B projects Perth's population to overtake Brisbane's in 2028, at 3 million people. In around 40 years, the population of Perth is projected to reach the current size of Sydney (4.8 million), while Brisbane's population is projected to increase to the current size of Melbourne's (4.3 million). Adelaide is projected to grow at a slower rate than the four larger capital cities, but nevertheless, its population will have doubled over the entire 80 year period.  population, smaller Greater Capital Cities - 1973 to 2053.gif) Footnote(s): (a) Projections based on Series B. Source(s): Regional Population Growth, Australia (cat. no. 3218.0), Population Projections, Australia, 2012 (base) to 2101 (cat. no. 3222.0) Among the three smallest capital cities, Canberra is projected to have the largest and fastest population growth, with its population projected to increase by 300,200 people (79%) between 2013 and 2053. Darwin is projected to become closer to the size of Hobart in future years, given its comparatively stronger growth rate. REFERENCES Regional Population Growth, Australia, 2012 (cat. no. 3218.0) - data for 1973 to 2011 Regional Population Growth, Australia, 2012-13 (cat. no. 3218.0) - data for 2012 and 2013 Population Projections, Australia, 2012 (based) to 2101 (cat. no. 3222.0) FOOTNOTES 1. Capital cites are defined based on the Greater Capital City Statistical Area (GCCSA) Structure of the Australian Statistical Geography Standard (cat. no. 1270.0.55.001). Under this structure, each state and territory is split into a capital city and rest of state region. The only exception is the Australian Capital Territory where there is one GCCSA region for the entire territory. For the purposes of this article, this region is referred to as Canberra. <back 2. For further information on population projections and assumptions, see Population Projections, Australia, 2012 (based) to 2101 (cat. no. 3222.0). <back Document Selection These documents will be presented in a new window.
|
|
