DECEMBER KEY FIGURES
 | Sep Qtr 10 to Dec Qtr 10 | Dec Qtr 09 to Dec Qtr 10 |
 | % change | % change |
|
| Import Price Index all groups | -3.8 | -1.0 |
| Food and live animals | -5.6 | -0.9 |
| Beverages and tobacco | -2.1 | -4.2 |
| Crude materials, inedible, except fuels | -0.2 | 12.4 |
| Mineral fuels, lubricants and related materials | -1.0 | 4.1 |
| Animal and vegetable oils, fats and waxes | 6.8 | -2.7 |
| Chemicals and related products, n.e.s. | -3.6 | -1.9 |
| Manufactured goods classified chiefly by material | -4.5 | 1.9 |
| Machinery and transport equipment | -4.2 | -4.3 |
| Miscellaneous manufactured articles | -6.7 | -4.7 |
| Commodities and transactions, n.e.s. | 2.1 | 15.6 |
| Export Price Index all groups | -8.1 | 19.4 |
| Food and live animals | 2.3 | 12.9 |
| Beverages and tobacco | -2.1 | -4.2 |
| Crude materials, inedible, except fuels | -12.7 | 43.2 |
| Mineral fuels, lubricants and related materials | -13.3 | 17.5 |
| Animal and vegetable oils, fats and waxes | 16.6 | 24.4 |
| Chemicals and related products, n.e.s. | -1.2 | 5.8 |
| Manufactured goods classified chiefly by material | -0.3 | 12.1 |
| Machinery and transport equipment | -5.1 | -4.5 |
| Miscellaneous manufactured articles | -4.0 | -7.9 |
| Commodities and transactions, n.e.s. | 1.1 | 14.9 |
|
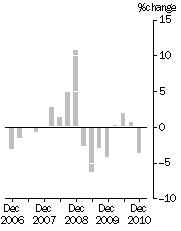
IMPORT PRICE INDEX: all groups, Quarterly % change

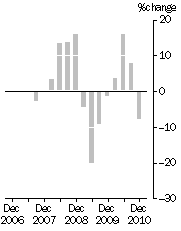
| EXPORT PRICE INDEX: all groups, Quarterly % change

|
DECEMBER KEY POINTS
IMPORT PRICE INDEX
- The Import Price Index decreased by 3.8% in the December quarter 2010. Through the year to December quarter 2010, the Import Price Index decreased by 1.0%.
EXPORT PRICE INDEX
- The Export Price Index decreased by 8.1% in the December quarter 2010. Through the year to December quarter 2010, the Export Price Index increased by 19.4%.
NOTES
FORTHCOMING ISSUES
| ISSUE (QUARTER) | Release Date |
| March 2011 | 20 April 2011 |
| June 2011 | 22 July 2011 |
| September 2011 | 21 October 2011 |
| December 2011 | 20 January 2012 |
IMPACT OF THE FLOODS
Flooding in Queensland began in late December 2010. It is expected that the first significant economic impact of this and floods in other states will be reflected in the March quarter 2011 release of this publication.
Price collection for the December quarter 2010 was not affected by the floods.
ROUNDING
Any discrepancies between totals and sums of components are due to rounding.
DATA REFERENCES
Data referenced in the Key Points and Commentary are available from the tables shown in this publication, or in the corresponding tables of this publication on the ABS website <
https://www.abs.gov.au>.
INQUIRIES
For further information about these and related statistics, contact the National Information and Referral Service on 1300 135 070.
 Print Page
 Print All