DECEMBER KEY FIGURES
 | Sep Qtr 17 to Dec Qtr 17 | Dec Qtr 16 to Dec Qtr 17 |
| % change | % change |
|
| Import Price Index all groups | 2.0 | 1.4 |
| Food and live animals | 0.0 | 0.3 |
| Beverages and tobacco | -0.4 | 0.5 |
| Crude materials, inedible, except fuels | 9.4 | 16.3 |
| Mineral fuels, lubricants and related materials | 11.5 | 15.0 |
| Animal and vegetable oils, fats and waxes | -1.3 | 7.1 |
| Chemicals and related products, n.e.s. | 3.1 | 6.0 |
| Manufactured goods classified chiefly by material | 0.1 | 0.6 |
| Machinery and transport equipment | 0.2 | -3.3 |
| Miscellaneous manufactured articles | 0.3 | 0.5 |
| Commodities and transactions, n.e.s. | 2.5 | 2.1 |
| Export Price Index all groups | 2.8 | 2.4 |
| Food and live animals | -0.3 | -1.2 |
| Beverages and tobacco | -0.5 | 10.8 |
| Crude materials, inedible, except fuels | 0.4 | 0.9 |
| Mineral fuels, lubricants and related materials | 7.1 | 4.0 |
| Animal and vegetable oils, fats and waxes | 1.4 | -29.6 |
| Chemicals and related products, n.e.s. | 5.6 | 4.2 |
| Manufactured goods classified chiefly by material | 7.4 | 17.8 |
| Machinery and transport equipment | 0.5 | -2.8 |
| Miscellaneous manufactured articles | -2.2 | -4.3 |
| Commodities and transactions, n.e.s. | 2.3 | 2.4 |
|
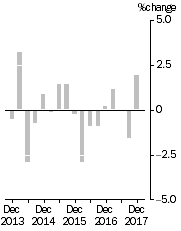
IMPORT PRICE INDEX: all groups, Quarterly % change
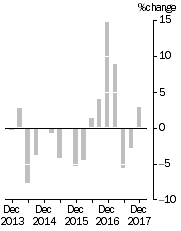
| EXPORT PRICE INDEX: all groups, Quarterly % change
|
DECEMBER KEY POINTS
IMPORT PRICE INDEX
- The Import Price Index rose 2.0% in the December quarter 2017. This follows a fall in the September quarter 2017 of 1.6%.
- The rise was driven by higher prices paid for Petroleum, petroleum products and related materials (+14.0%), Fertilizers (excluding crude) (+23.1%), Inorganic Chemicals (+13.1%) and Organic Chemicals (+10.0%).
- Through the year to the December quarter 2017, the Import Price Index rose 1.4%, driven by Petroleum, petroleum products and related materials (+17.0%).
EXPORT PRICE INDEX
- The Export Price Index rose 2.8% in the December quarter 2017. This follows a fall in the September quarter 2017 of 3.0%.
- The rise was driven by higher prices received for Coal, coke and briquettes (+9.0%), Petroleum, petroleum products and related materials (+19.7%), Non-ferrous metals (+9.8%), Cereals and cereal preparations (+7.3%) and Gold, non monetary (+2.5%).
- Through the year to the December quarter 2017, the Export Price Index rose 2.4%, driven by Non-ferrous metals (+18.3%).
EXCHANGE RATE
- The depreciation of the Australian dollar against the United States dollar had an upward effect on import and export prices in the December quarter 2017.
NOTES
FORTHCOMING ISSUES
| ISSUE (QUARTER) | Release Date |
| March 2018 | 26 April 2018 |
| June 2018 | 26 July 2018 |
| September 2018 | 1 November 2018 |
| December 2018 | 31 January 2019 |
PRIVACY
The
ABS Privacy Policy outlines how the ABS will handle any personal information that you provide to the ABS.
INQUIRIES
For further information about these and related statistics, contact the National Information and Referral Service on 1300 135 070.
 Quality Declaration
  Print Page
 Print All