SEPTEMBER QUARTER KEY FIGURES
 | Jun Qtr 04 to Sep Qtr 04 | Sep Qtr 03 to Sep Qtr 04 |
 | % change | % change |
|
| Import Price Index all groups | 2.6 | -0.6 |
| Food and live animals | 2.3 | 0.3 |
| Beverages and tobacco | -1.3 | -2.8 |
| Crude materials | 5.0 | -0.7 |
| Mineral fuels, etc. | 12.4 | 23.0 |
| Animal and vegetable oils, etc. | 10.6 | 10.3 |
| Chemicals and related products | 2.0 | 2.4 |
| Manufactured goods by material | 3.8 | 2.4 |
| Machinery and transport equipment | 1.0 | -4.9 |
| Miscellaneous manufactured articles | 1.9 | -4.3 |
| Commodities and transactions n.e.s. | 2.8 | 2.7 |
| Export Price Index all groups | 6.9 | 12.3 |
| Food and live animals | 5.4 | 8.1 |
| Beverages and tobacco | 2.1 | 2.3 |
| Crude materials | 5.5 | 10.8 |
| Mineral fuels, etc. | 15.5 | 24.4 |
| Chemicals and related products | 2.0 | 15.2 |
| Manufactured goods by material | 9.3 | 26.6 |
| Machinery and transport equipment | 0.7 | -4.9 |
| Miscellaneous manufactured articles | 0.9 | -5.1 |
|
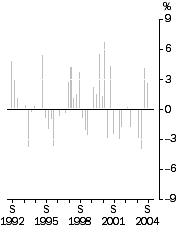
IMPORT PRICE INDEX: all groups, Quarterly % change

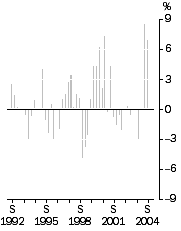
| EXPORT PRICE INDEX: all groups, Quarterly % change

|
SEPTEMBER QUARTER KEY POINTS
IMPORT PRICE INDEX
- The Import Price Index increased by 2.6 % in the September quarter 2004, following a 4.1% increase in the June quarter 2004. Contributing most to the increase were crude petroleum oils and other fuel oils and related products, due to world prices, and aircraft and motor vehicle parts. The increases were partially driven by the depreciation of the Australian dollar against all major currencies. The most significant offsetting price decreases were observed for colour televisions and monitors, and communication transmission apparatus.
EXPORT PRICE INDEX
- The Export Price Index increased by 6.9% in the September quarter 2004, following an 8.4% increase in the June quarter 2004. Increases were registered this quarter for the majority of commodities, with the most significant contributors being coal and semi-coke, crude petroleum oils, frozen beef and manganese ores and concentrates.
NOTES
CHANGES IN THIS ISSUE
Both the Import Price Index and the Export Price Index have been reweighted in the September quarter 2004. This is in line with the ABS' policy of reweighting these indexes annually in the September quarter, as explained in paragraphs 8-10 of the Explanatory Notes. The new weighting patterns are provided in an Appendix to this issue.
As a consequence of this annual reweighting, points contribution data for June quarter 2004 shown in Tables 2, 8 and 17 differ from those published in the previous issue of this publication.
ROUNDING
Any discrepancies between totals and sums of components in this publication are due to rounding.
RELATED STATISTICS
For more information about statistics in this publication and about other 'ABS data available on request', contact Steve Whennan on (02) 6252 6251, or email <steve.whennan@abs.gov.au>.
INQUIRIES
For further information about these and related statistics, contact the National Information and Referral Service on 1300 135 070 or Steve Whennan on Canberra (02) 6252 6251.
 Print Page
 Print All