MARCH KEY FIGURES
 | Mar qtr 06 | Dec qtr 05 to Mar qtr 06 | Mar qtr 05 to Mar qtr 06 |  |
 | $m | % change | % change |  |
TREND ESTIMATES(a) |  |
|  |
| Value of Work Done | 13 163.7 | -2.4 | -2.5 |  |
| New residential building | 6 942.9 | -4.0 | -8.2 |  |
| Alterations and additions to residential building | 1 298.6 | -3.9 | -6.1 |  |
| Non-residential building | 4 906.4 | 0.1 | 7.6 |  |
SEASONALLY ADJUSTED ESTIMATES(a) |  |
|  |
| Value of Work Done | 13 154.8 | -1.5 | 0.2 |  |
| New residential building | 6 954.3 | -2.6 | -5.6 |  |
| Alterations and additions to residential building | 1 258.7 | -8.5 | -6.5 |  |
| Non-residential building | 4 941.9 | 2.1 | 12.0 |  |
|  |
| (a) Chain volume measures, reference year 2003-04. |
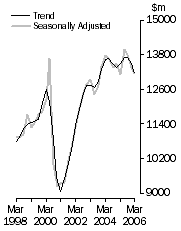
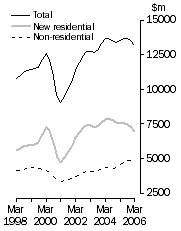
Value of work done, Volume terms

| Value of work done, Volume terms - Trend estimates

|
MARCH KEY POINTS
VALUE OF WORK DONE, VOLUME TERMS
TREND ESTIMATES
- The trend estimate of the value of total building work done fell 2.4% in the March quarter 2006.
- The value of new residential building work fell 4.0% in the latest quarter. New houses fell 2.9%, and new other residential buildings fell 6.3%. Alterations and additions fell 3.9% while non-residential work done in the quarter rose 0.1%.
SEASONALLY ADJUSTED ESTIMATES
- The seasonally adjusted March quarter estimate of work done is down 1.5%, to $13,154.8m, on the revised December quarter estimate.
- New residential work fell 2.6%, to $6,954.3m. Work on new houses fell 1.6%, to $4,754.7m, while new other residential building work fell 4.7%, to $2,199.5m. Alterations and additions fell 8.5%, to $1,258.7m. Non-residential work done in the quarter rose 2.1%, to $4,941.9m.
NOTES
FORTHCOMING ISSUES
| ISSUE (QUARTER) | Release Date |
| June 2006 | 13 October 2006 |
| September 2006 | 22 January 2007 |
ABOUT THIS ISSUE
This publication contains detailed estimates from the quarterly Building Activity Survey. The data are subject to revision when returns from the following quarter are processed. Final data for the March quarter 2006 will be released in Building Activity, Australia (cat. no. 8752.0) on 13 October 2006.
CHANGES IN THIS ISSUE
The estimates for the Northern Territory are now based on a sample rather than a complete census of all building jobs. As a result these estimates are subject to sample error. Tables 38 and 39 provide estimates of relative standard errors.
SIGNIFICANT REVISIONS THIS ISSUE
There are no significant revisions in this issue.
INQUIRIES
For further information about these and related statistics, contact the National Information and Referral Service on 1300 135 070 or Tamra Guiver on Adelaide (08) 8237 7655.
VALUE OF WORK DONE VOLUME TERMS MARCH QTR 2006
SUMMARY COMMENTS
- In the March quarter 2006, the seasonally adjusted estimate of total building work done fell in half of the states and territories with Victoria (-8.0%) and the Northern Territory (-6.9%) recording the largest falls. These falls offset rises in New South Wales (+0.2%), South Australia (+6.5%), Tasmania (+14.3%) and the Australian Capital Territory (+15.9%).
- In original terms, all states and territories fell, with the exception of the Australian Capital Territory (+16.3%).
 |  | NSW | Vic. | Qld | SA | WA | Tas. | NT | ACT | Aust. |  |
Original(a) |  |
|  |
| Value of work done |  |  |  |  |  |  |  |  |  |  |
 | New residential building ($m) | 1 640.6 | 1 694.9 | 1 650.6 | 401.3 | 873.1 | 98.8 | 58.7 | 113.5 | 6 531.5 |  |
 | Alterations and additions to residential building ($m) | 393.9 | 323.5 | 212.9 | 79.6 | 79.4 | 21.7 | 8.8 | 19.9 | 1 139.6 |  |
 | Non-residential building ($m) | 1 494.7 | 1 173.8 | 884.7 | 290.1 | 355.2 | 73.0 | 42.0 | 201.5 | 4 515.0 |  |
 | Total building ($m) | 3 529.2 | 3 192.2 | 2 748.2 | 770.9 | 1 307.7 | 193.5 | 109.5 | 334.9 | 12 186.1 |  |
| Percentage change |  |  |  |  |  |  |  |  |  |  |
 | New residential building (%) | -6.3 | -17.1 | -16.6 | -1.8 | -1.7 | 1.9 | -19.7 | 3.8 | -11.2 |  |
 | Alterations and additions to residential building (%) | -25.4 | -23.2 | -21.5 | -2.6 | -10.3 | -15.9 | -37.8 | -22.8 | -21.8 |  |
 | Non-residential building (%) | -5.5 | -18.0 | -15.4 | -1.9 | -13.8 | -2.8 | -29.3 | 31.9 | -10.7 |  |
 | Total building (%) | -8.6 | -18.1 | -16.7 | -1.9 | -5.8 | -2.2 | -25.3 | 16.3 | -12.1 |  |
Seasonally Adjusted(a) |  |
|  |
| Value of work done |  |  |  |  |  |  |  |  |  |  |
 | New residential building ($m) | 1 738.0 | 1 805.7 | 1 799.8 | 418.0 | 880.2 | 103.3 | 68.8 | 122.4 | 6 954.3 |  |
 | Alterations and additions to residential building ($m) | 434.3 | 354.2 | 251.7 | 84.9 | 79.9 | 24.1 | - | 23.7 | 1 258.7 |  |
 | Non-residential building ($m) | 1 564.2 | 1 326.4 | 999.5 | 309.0 | 373.8 | 87.5 | - | 192.4 | 4 941.9 |  |
 | Total building ($m) | 3 736.5 | 3 486.3 | 3 051.0 | 811.9 | 1 333.9 | 214.9 | 123.0 | 338.6 | 13 154.8 |  |
| Percentage change |  |  |  |  |  |  |  |  |  |  |
 | New residential building (%) | 1.6 | -10.5 | -4.1 | 5.6 | 0.1 | 13.7 | 8.0 | 7.6 | -2.6 |  |
 | Alterations and additions to residential building (%) | -9.9 | -14.4 | 1.9 | 6.1 | -9.6 | 0.2 | - | -2.6 | -8.5 |  |
 | Non-residential building (%) | 2.0 | -2.3 | 2.3 | 7.9 | -4.7 | 19.6 | - | 24.9 | 2.1 |  |
 | Total building (%) | 0.2 | -8.0 | -1.6 | 6.5 | -1.9 | 14.3 | -6.9 | 15.9 | -1.5 |  |
|  |
| - nil or rounded to zero (including null cells) |
| (a) Chain volume measures, reference year 2003-04. |
VALUE OF WORK DONE VOLUME TERMS
TREND ESTIMATES
NEW SOUTH WALES, VICTORIA
The trend estimate of the total value of building work done in New South Wales has been in decline since March 2004. The total value of building work done is now showing falls for the last three quarters in Victoria.
QUEENSLAND, WESTERN AUSTRALIA
The trend estimate of the total value of building work done in Queensland has fallen in the last two quarters. The total value of building work done in Western Australia shows ten consecutive quarters of growth.
SOUTH AUSTRALIA, TASMANIA
The trend estimate of the total value of building work done in South Australia shows falls for the last three quarters after four years of growth. The total value of building work done in Tasmania has fallen in the last two quarters.
NORTHERN TERRITORY, AUSTRALIAN CAPITAL TERRITORY
The trend estimate of the total value of building work done in the Northern Territory is now showing three quarters of decline. The Australian Capital Territory shows growth for the past five quarters.
VALUE OF WORK COMMENCED VOLUME TERMS
TREND AND SEASONALLY ADJUSTED ESTIMATES
 | Mar qtr 06 | Dec qtr 05 to Mar qtr 06 | Mar qtr 05 to Mar qtr 06 |  |
 | $m | % change | % change |  |
Trend(a) |  |
|  |
| Value of work commenced | 13 166.7 | -2.5 | -0.2 |  |
| New residential building | 7 067.1 | -0.9 | -1.8 |  |
| Alterations and additions to residential building | 1 385.5 | 2.5 | 5.1 |  |
| Non-residential building | 4 746.0 | -5.4 | 1.5 |  |
Seasonally Adjusted(a) |  |
|  |
| Value of work commenced | 13 125.0 | -0.9 | 2.2 |  |
| New residential building | 7 392.5 | 10.0 | 8.1 |  |
| Alterations and additions to residential building | 1 413.7 | 4.6 | 7.0 |  |
| Non-residential building | 4 318.9 | -16.4 | -7.8 |  |
|  |
| (a) Chain volume measures, reference year 2003-04. |
TREND
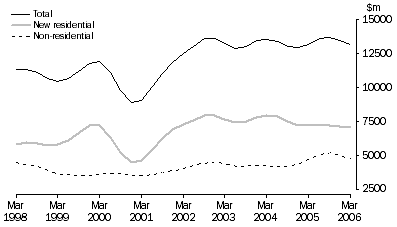
- The March quarter 2006 trend estimate of the total value of building work commenced fell 2.5% from the December quarter estimate.
- The value of new residential building commenced fell 0.9% in the March quarter 2006. New house commencements fell 1.4% while new other residential commencements rose 0.4%. The value of commencements for alterations and additions to residential buildings rose 2.5%. The value of non-residential building fell by 5.4%.
Value of Work Commenced in Volume Terms, Trend

SEASONALLY ADJUSTED
- In seasonally adjusted terms, the total value of building work commenced fell 0.9% in the March quarter 2006, to $13,125.0m.
- Commencements of new residential buildings rose 10.0%, to $7,392.5m. New house commencements rose 3.1%, to $4,945.6m, while new other residential building rose 27.1%, to $2,446.9m. Alterations and additions rose 4.6%, to $1,413.7m. Non-residential work commenced fell 16.4%, to $4,318.9m.
 Print Page
 Print All