NOVEMBER KEY FIGURES
 | | Nov 14 | Oct 14 to Nov 14 | Nov 13 to Nov 14 |
| | no. | % change | % change |
|
| TREND | | | |
| Total dwelling units approved | 16 488 | 0.2 | -0.7 |
| Private sector houses | 9 328 | -0.3 | 5.7 |
| Private sector dwellings excluding houses | 6 986 | 1.0 | -7.7 |
| SEASONALLY ADJUSTED | | | |
| Total dwelling units approved | 18 245 | 7.5 | 10.1 |
| Private sector houses | 9 305 | -0.3 | 3.8 |
| Private sector dwellings excluding houses | 8 745 | 16.7 | 19.1 |
|
Dwelling units approved

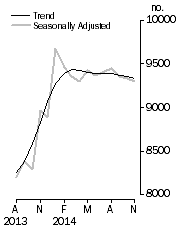
| Private sector houses approved
|
NOVEMBER KEY POINTS
TOTAL DWELLING UNITS
- The trend estimate for total dwellings approved rose 0.2% in November and has risen for six months.
- The seasonally adjusted estimate for total dwellings approved rose 7.5% in November and has risen for two months.
PRIVATE SECTOR HOUSES
- The trend estimate for private sector houses approved fell 0.3% in November and has fallen for eight months.
- The seasonally adjusted estimate for private sector houses fell 0.3% in November and has fallen for three months.
PRIVATE SECTOR DWELLINGS EXCLUDING HOUSES
- The trend estimate for private sector dwellings excluding houses rose 1.0% in November and has risen for six months.
- The seasonally adjusted estimate for private sector dwellings excluding houses rose 16.7% in November and has risen for two months.
VALUE OF BUILDING APPROVED
- The trend estimate of the value of total building approved fell 0.7% in November and has fallen for 12 months. The value of residential building fell 0.5% and has fallen for five months. The value of non-residential building fell 1.0% following a rise of 0.5% in the previous month.
- The seasonally adjusted estimate of the value of total building approved rose 19.6% in November and has risen for two months. The value of residential building rose 15.3% and has risen for two months. The value of non-residential building rose 29.7% following a fall of 13.1% in the previous month.
NOTES
FORTHCOMING ISSUES
| ISSUE | Release Date |
| November 2014 - Additional | 15 January 2015 |
| December 2014 | 3 February 2015 |
| December 2014 - Additional | 10 February 2015 |
| January 2015 | 3 March 2015 |
| January 2015 - Additional | 11 March 2015 |
| February 2015 | 1 April 2015 |
DATA NOTES
A number of time series spreadsheets contain 'np' (not available for publication) annotations. This is due to confidential data being contained in these series.
Small area data cubes will be released in an "Additional Information" release five business days after the main publication. The data cubes will be for Statistical Area Level 2 and Local Government Areas. Release dates are published under the "Forthcoming Issues" section of the publication and in ABS Release Advice.
A new base year, 2012-13, has been introduced into the chain volume estimates which has resulted in revisions to growth rates in subsequent periods. In addition, the chain volume estimates have been re-referenced to 2012-13, thereby preserving additivity in the quarters after the reference year. Re-referencing affects the levels of, but not the movements in, chain volume estimates. For further information, see the explanatory notes.
REVISIONS THIS MONTH
Revisions to the total number of dwelling units approved in this issue are:
| Dwellings | 2013-14 | 2014-15 | TOTAL |
|
| NSW | 21 | 24 | 45 |
| Vic. | 27 | -21 | 6 |
| Qld | -44 | - | -44 |
| SA | -6 | - | -6 |
| WA | - | 3 | 3 |
| Tas. | 17 | - | 17 |
| NT | - | - | - |
| ACT | - | - | - |
| Total | 15 | 6 | 21 |
|
| - nil or rounded to zero (including null cells) |
INQUIRIES
For further information about these and related statistics, contact the National Information and Referral Service on 1300 135 070.
 Quality Declaration
  Print Page
 Print All