PRICE INDEXES AND CONTRACT PRICE INDEXATION
1 ALL GROUPS, INDEX NUMBERS(a)
2 ALL GROUPS, PERCENTAGE CHANGES
CPI All GROUPS, WEIGHTED AVERAGE OF EIGHT CAPITAL CITIES, INDEX NUMBERS(a)
MARCH QTR KEY FIGURES
 | Dec Qtr 2005 to Mar Qtr 2006 | Mar Qtr 2005 to Mar Qtr 2006 | |
| Weighted average of eight capital cities | % change | % change | |
| |
| Food | 1.4 | 4.2 | |
| Alcohol and tobacco | 1.3 | 3.3 | |
| Clothing and footwear | -2.5 | -1.7 | |
| Housing | 0.6 | 3.3 | |
| Household contents and services | -0.4 | 1.8 | |
| Health | 4.4 | 4.6 | |
| Transportation | 1.3 | 6.3 | |
| Communication | 0.5 | -1.9 | |
| Recreation | 0.6 | 0.5 | |
| Education | 5.6 | 5.9 | |
| Financial and insurance services | -0.6 | . . | |
| All groups | 0.9 | 3.0 | |
| All groups excluding Housing and Financial and insurance services | 1.1 | 3.1 | |
| |
| . . not applicable |
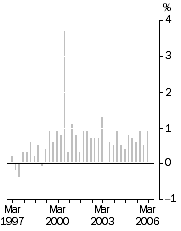
All Groups, Quarterly change
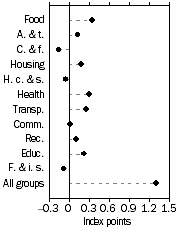
| Contribution to quarterly change, March quarter 2006
|
MARCH QTR KEY POINTS
THE ALL GROUPS CPI
- rose 0.9% in the March quarter 2006 compared with 0.5% in the December quarter.
- rose 3.0% through the year to March quarter 2006.
OVERVIEW OF CPI MOVEMENTS
- Contributing most to the overall increase this quarter were pharmaceuticals (+14.2%), vegetables (+7.9%), motor vehicles (+1.4%), secondary education (+6.9%), tertiary education (+4.8%), automotive fuel (+1.4%), overseas holiday travel and accommodation (+2.6%), rents (+0.8%), hospital and medical services (+1.4%), beer (+1.6%) and tobacco (+1.4%).
- The most significant offsetting price falls were deposit and loan facilities (-2.1%), furniture (-3.2%), clothing and footwear accessories (-3.5%), audio, visual and computing equipment (-1.5%), men's outerwear (-2.6%), women's outerwear (-1.6%), children's and infants' clothing (-4.0%) and towels and linen (-2.1%).
NOTES
FORTHCOMING ISSUES
| ISSUE (QUARTER) | Release Date |
| June 2006 | 26 July 2006 |
| September 2006 | 25 October 2006 |
CHANGES IN THIS ISSUE
There are no changes in this issue.
CHANGES TO TIME SERIES SPREADSHEETS
The time series spreadsheets associated with this publication have been converted from Lotus 1-2-3 .wks format to Excel .xls format. Information paper: Changes to Time Series Spreadsheets for Consumer Price Index, Australia (6401.0.55.001), advising users of this change, was released on 3 March 2006 and provides a concordance between the old Lotus 1-2-3 .wks spreadsheets and the new Excel .xls spreadsheets.
ROUNDING
Any discrepancies between totals and sums of components in this publication are due to rounding.
ABBREVIATIONS
ABS Australian Bureau of Statistics
CPI Consumer Price Index
INQUIRIES
For further information about these and related statistics, contact Steve Whennan on Canberra (02) 6252 6251 or the National Information and Referral Service on 1300 135 070.
ANALYSES AND COMMENTS
MAIN CONTRIBUTORS TO CHANGE
CPI GROUPS
Weighted average of eight capital cities, Percentage change from previous quarter
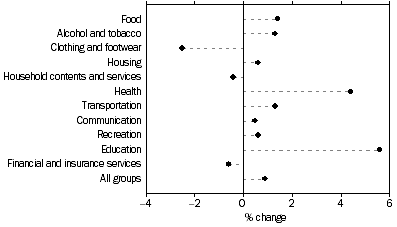
The discussion of the CPI groups below is ordered in terms of their significance to the change in All groups index points (see tables 6 and 7).
FOOD (+1.4%)
The rise in food prices was largely due to vegetables (+7.9%), soft drinks, waters and juices (+2.3%), restaurant meals (+1.0%), bread (+1.6%), snacks and confectionery (+1.0%), take away and fast foods (+0.7%) and food n.e.c. (+2.6%). Other cereal products (-1.8%), poultry (-1.1%) and fruit (-0.8%) provided minor offsetting price falls.
The rise in vegetable prices was due to adverse weather in major growing areas in eastern Australia, together with some seasonal shortages affecting supplies and quality of some vegetables, in particular, lettuces, cauliflower, cabbages and potatoes.
Increasing fuel and packaging costs were cited by a number of respondents as contributing to price rises in a number of food categories.
Through the year to March quarter 2006, the food group rose 4.2%.
HEALTH (+4.4%)
The rise in health costs was due to pharmaceuticals (+14.2%), hospital and medical services (+1.4%) and dental services (+2.1%).
Pharmaceuticals prices rose as a result of the cyclical reduction in the proportion of consumers who qualify for subsidised medications under the Pharmaceuticals Benefit Scheme at the start of each calendar year. The rise in hospital and medical services reflects increases in gross fees for most medical practitioners' services, combined with a cyclical reduction in the proportion of consumers who qualify for subsidies for out-of-hospital medical expenses under the Medicare Plus safety net at the start of each calendar year, and a small fall in the overall bulk billing ratio for medical services.
Through the year to March quarter 2006, the health group rose 4.6%.
TRANSPORTATION (+1.3%)
Most categories of transportation rose this quarter with motor vehicles (+1.4%), automotive fuel (+1.4%) and motor vehicle repair and servicing (+1.4%) being the most significant.
The rise in motor vehicles was the first increase since December quarter 2004. A number of new models were released in the March quarter 2006, together with most dealers now distributing 2006 plated vehicles for existing models. This meant there were fewer incentives and bonuses being offered during the quarter.
Automotive fuel prices fell in October (-3.6%), November (-6.2%) and December (-2.0%), rose in January (+5.3%), fell in February (-1.3%) and rose in March (+1.9%), resulting in an overall rise of 1.4% between December quarter 2005 and March quarter 2006. The following graph shows the pattern of the average daily price behaviour for unleaded petrol for the eight capital cities over the last fifteen months.
Through the year to March quarter 2006, the transportation group rose 6.3%.
EDUCATION (+5.6%)
All levels of education rose in the March quarter, coinciding with the commencement of the new school year. Secondary education rose 6.9%, tertiary education rose 4.8% and preschool and primary education rose 5.4%.
Secondary and primary education fees rose in order to cover increasing wage, IT and other operating costs. The rise in tertiary education was due to the effect of the increase in the Higher Education Indexation Factor (HEIF) on student contributions for all university courses, together with an increase in the proportion of students subject to the arrangements whereby tertiary institutions can charge up to 25% above the basic student contribution range for most courses, for students enrolling for the first time after 2005.
Through the year to March quarter 2006, the education group rose 5.9%.
HOUSING (+0.6%)
Most categories of housing recorded price rises this quarter with rents (+0.8%), house purchase (+0.3%), electricity (+1.5%), gas and other household fuels (+2.4%), water and sewerage (+1.0%) and house repairs and maintenance (+0.4%) contributing to the increase.
Rents rose in all capital cities, with the increases ranging from 0.3% in Melbourne to 1.7% in Hobart. The 0.3% rise in house purchase was the lowest quarterly increase since June quarter 2001. House purchase rose in Adelaide (+0.7%), Perth (+3.4%), Hobart (+1.9%), Darwin (+3.1%) and Canberra (+0.9%), was flat in Brisbane and fell in Sydney (-0.3%) and Melbourne (-0.8%). A number of builders in Sydney and Melbourne introduced various bonuses and incentives during the quarter to attract new home buyers, reporting a slowing in dwelling commencements as a contributing factor.
Through the year to March quarter 2006, the housing group rose 3.3%.
CLOTHING AND FOOTWEAR (-2.5%)
The 2.5% fall for the clothing and footwear group in the March quarter 2006, was the largest quarterly decrease on record. All categories of clothing and footwear, except clothing services and shoe repairs (+0.7%), fell in the March quarter, with accessories (-3.5%), men's outerwear (-2.6%), women's outerwear (-1.6%) and children's and infants' clothing (-4.0%) being the most significant.
Pre-Christmas/January and end of summer season sales had a significant impact on the overall price movements this quarter. Retailers introduced strong and widespread discounting activity in all capital cities during the period in an attempt to increase sales activity after an unexpectedly slow lead up to Christmas.
Through the year to March quarter 2006, the clothing and footwear group fell 1.7%.
ALCOHOL AND TOBACCO (+1.3%)
Prices for all components of alcohol and tobacco rose this quarter with beer (+1.6%), tobacco (+1.4%), spirits (+1.5%) and wine (+0.4%) all contributing.
The increase for beer, tobacco and spirits was mainly due to the indexed adjustment to the rate of Federal excise and customs duty from 1 February.
Through the year to March quarter 2006, the alcohol and tobacco group rose 3.3%.
RECREATION (+0.6%)
The rise in the recreation index was mainly due to overseas holiday travel and accommodation (+2.6%), domestic holiday travel and accommodation (+1.0%), and other recreational activities (+1.4%). These increases were partially offset by a fall in audio, visual and computing equipment (-1.5%).
The rise in overseas holiday travel and accommodation was due to increases in airfares to all destinations in the price survey, in particular, to Asia and North America. The rise in domestic holiday travel and accommodation was largely a result of the seasonal increase in holiday accommodation tariffs due to the strong demand in January each year.
Through the year to March quarter 2006, the recreation group rose 0.5%.
FINANCIAL AND INSURANCE SERVICES (-0.6%)
The fall in financial and insurance services resulted from a decrease in deposit and loan facilities (-2.1%) being only partially offset by rises in other financial services (+0.6%) and insurance services (+0.7%).
The deposit and loan facilities component aims to measure the total cost of the financial service and therefore covers both those fees and charges levied directly on households and those paid indirectly via differences in interest rates on loans and those on deposits ('interest rate margins').
HOUSEHOLD CONTENTS AND SERVICES (-0.4%)
The fall in household contents and services was mainly due to furniture (-3.2%), towels and linen (-2.1%) and glassware, tableware and household utensils (-2.0%). These falls were partially offset by a rise in child care (+5.1%) and toiletries and personal care products (+1.1%).
The net price rise in child care was due to increases in gross fees charged by child care providers, with many centres reviewing fees at the start of a new year to cover increases in wages and other running costs, and adjustments to income levels more than offsetting increases in the Child Care Benefit.
Through the year to March quarter 2006, the household contents and services group rose 1.8%.
TRADABLES AND NON-TRADABLES
The non-tradables component (see table 8) of the CPI rose 0.9% in the March quarter 2006. This component includes goods and services whose prices are largely determined by domestic price pressures and represents approximately 58% of the weight of the CPI. Within non-tradables, the goods component rose 0.7%, mainly due to beer, house purchase, electricity, bread, take away and fast foods, and gas and other households fuels. The non-tradables services component rose 0.9% with education, rents, hospital and medical services, child care, motor vehicle repair and servicing, domestic holiday travel and accommodation, and other financial services being the main contributors. Falls in deposit and loan facilities provided the most significant offset.
The tradables component, which includes goods and services whose prices are largely determined on the world market rose 0.8% in the March quarter. The largest positive contributors were pharmaceuticals, vegetables, motor vehicles, automotive fuel and overseas holiday travel and accommodation. The largest negative contributors were furniture, clothing and footwear accessories and audio, visual and computing equipment.
Through the year to March quarter 2006, non-tradables rose 3.1% and tradables rose 2.8%. This compares with rises of 3.5% and 2.0%, respectively, for these components through the year to December quarter 2005.
CAPITAL CITIES COMPARISON
ALL GROUPS
All Groups: Percentage change from previous quarter
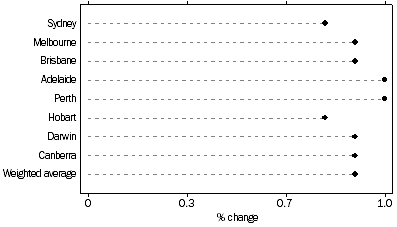
At the All groups level, the CPI rose in all capital cities in the March quarter 2006, with the increases ranging from 0.8% in Sydney and Hobart to 1.0% in Adelaide and Perth. The other capital cities all rose 0.9%.
Through the year to March quarter 2006, the All groups CPI rose in each of the eight capital cities and ranged from 2.7% in Sydney to 4.2% in Perth. The higher result for Perth was largely due to a 8.7% increase in housing, more than double the weighted average of eight capital cities of 3.3%. The rise in Perth's housing cost was largely attributable to a 15.2% increase in new house purchase prices through the year.
CPI, All groups index numbers and percentage changes |
| |
| Index number(a) | Percentage change | |
| Mar Qtr 2006 | Dec Qtr 2005 to Mar Qtr 2006 | Mar Qtr 2005 to Mar Qtr 2006 | |
| |
| Sydney | 152.2 | 0.8 | 2.7 | |
| Melbourne | 150.5 | 0.9 | 2.8 | |
| Brisbane | 153.5 | 0.9 | 2.9 | |
| Adelaide | 155.6 | 1.0 | 3.1 | |
| Perth | 150.5 | 1.0 | 4.2 | |
| Hobart | 152.2 | 0.8 | 2.8 | |
| Darwin | 146.7 | 0.9 | 3.4 | |
| Canberra | 152.2 | 0.9 | 3.5 | |
| Weighted average of eight capital cities | 151.9 | 0.9 | 3.0 | |
| |
| (a) Base of each index: 1989-90 = 100.0. |
|
SELECTED TABLES FROM CONSUMER PRICE INDEX, AUSTRALIA (CAT. NO. 6401.0)
1 ALL GROUPS, INDEX NUMBERS(a)
ALL GROUPS, Index numbers(a) |
|
| Period | Sydney | Melbourne | Brisbane | Adelaide | Perth | Hobart | Darwin | Canberra | Weighted average of eight capital cities |
|
| 2001-02 | 137.2 | 135.3 | 136.3 | 137.2 | 133.1 | 134.7 | 133.7 | 135.2 | 136.0 |
| 2002-03 | 141.1 | 139.7 | 140.7 | 142.7 | 136.8 | 139.1 | 136.8 | 139.7 | 140.2 |
| 2003-04 | 144.1 | 142.8 | 144.8 | 147.0 | 139.6 | 142.6 | 138.7 | 143.4 | 143.5 |
| 2004-05 | 147.7 | 145.7 | 148.5 | 150.4 | 144.0 | 147.1 | 141.8 | 146.7 | 147.0 |
| 2002 | | | | | | | | | |
| March | 137.9 | 136.0 | 137.1 | 137.7 | 133.7 | 135.2 | 133.8 | 135.6 | 136.6 |
| June | 138.8 | 136.9 | 138.1 | 139.1 | 134.6 | 137.0 | 135.0 | 137.2 | 137.6 |
| September | 139.6 | 137.8 | 139.2 | 140.3 | 135.8 | 137.5 | 135.4 | 138.1 | 138.5 |
| December | 140.4 | 139.0 | 139.9 | 141.5 | 136.4 | 138.0 | 136.2 | 139.2 | 139.5 |
| 2003 | | | | | | | | | |
| March | 142.1 | 140.9 | 141.8 | 144.6 | 137.4 | 140.0 | 137.5 | 140.7 | 141.3 |
| June | 142.2 | 140.9 | 141.8 | 144.3 | 137.4 | 140.8 | 137.9 | 140.7 | 141.3 |
| September | 142.4 | 141.8 | 143.3 | 145.4 | 138.6 | 141.1 | 137.8 | 141.9 | 142.1 |
| December | 143.6 | 142.1 | 144.2 | 146.2 | 139.2 | 142.0 | 138.5 | 142.9 | 142.8 |
| 2004 | | | | | | | | | |
| March | 145.0 | 143.5 | 145.4 | 147.7 | 139.6 | 143.0 | 139.0 | 143.9 | 144.1 |
| June | 145.5 | 143.9 | 146.3 | 148.6 | 141.0 | 144.3 | 139.6 | 144.8 | 144.8 |
| September | 146.2 | 144.2 | 146.8 | 149.0 | 142.0 | 145.0 | 140.8 | 145.5 | 145.4 |
| December | 147.3 | 145.3 | 148.0 | 150.0 | 143.3 | 146.7 | 141.1 | 146.3 | 146.5 |
| 2005 | | | | | | | | | |
| March | 148.2 | 146.4 | 149.2 | 150.9 | 144.4 | 148.0 | 141.9 | 147.0 | 147.5 |
| June | 149.0 | 146.9 | 150.0 | 151.8 | 146.3 | 148.8 | 143.2 | 147.8 | 148.4 |
| September | 150.5 | 148.6 | 150.9 | 153.4 | 147.8 | 150.1 | 144.7 | 149.7 | 149.8 |
December
2006
March | 151.0
152.2 | 149.2
150.5 | 152.1
153.5 | 154.1
155.6 | 149.0
150.5 | 151.0
152.2 | 145.4
146.7 | 150.9
152.2 | 150.6
151.9 |
|
| (a) Base of each index: 1989-90 = 100.0. |
|
2 ALL GROUPS, PERCENTAGE CHANGES
ALL GROUPS, Percentage changes |
|
| Period | Sydney | Melbourne | Brisbane | Adelaide | Perth | Hobart | Darwin | Canberra | Weighted average of eight capital cities |
Percentage Change (from previous financial year) |
|
| 2001-02 | 3.0 | 2.8 | 2.9 | 2.8 | 2.7 | 2.0 | 2.1 | 2.5 | 2.9 |
| 2002-03 | 2.8 | 3.3 | 3.2 | 4.0 | 2.8 | 3.3 | 2.3 | 3.3 | 3.1 |
| 2003-04 | 2.1 | 2.2 | 2.9 | 3.0 | 2.0 | 2.5 | 1.4 | 2.6 | 2.4 |
| 2004-05 | 2.5 | 2.0 | 2.6 | 2.3 | 3.2 | 3.2 | 2.2 | 2.3 | 2.4 |
Percentage Change (from corresponding quarter of previous year) |
|
| 2002 | | | | | | | | | |
| March | 2.9 | 2.9 | 3.3 | 2.7 | 3.2 | 2.3 | 2.4 | 2.6 | 2.9 |
| June | 2.8 | 2.9 | 3.1 | 3.0 | 2.4 | 2.7 | 2.1 | 2.8 | 2.8 |
| September | 3.1 | 3.1 | 3.7 | 3.7 | 3.3 | 3.5 | 2.2 | 3.7 | 3.2 |
| December | 2.8 | 3.1 | 3.0 | 3.6 | 2.9 | 3.1 | 2.0 | 3.2 | 3.0 |
| 2003 | | | | | | | | | |
| March | 3.0 | 3.6 | 3.4 | 5.0 | 2.8 | 3.6 | 2.8 | 3.8 | 3.4 |
| June | 2.4 | 2.9 | 2.7 | 3.7 | 2.1 | 2.8 | 2.1 | 2.6 | 2.7 |
| September | 2.0 | 2.9 | 2.9 | 3.6 | 2.1 | 2.6 | 1.8 | 2.8 | 2.6 |
| December | 2.3 | 2.2 | 3.1 | 3.3 | 2.1 | 2.9 | 1.7 | 2.7 | 2.4 |
| 2004 | | | | | | | | | |
| March | 2.0 | 1.8 | 2.5 | 2.1 | 1.6 | 2.1 | 1.1 | 2.3 | 2.0 |
| June | 2.3 | 2.1 | 3.2 | 3.0 | 2.6 | 2.5 | 1.2 | 2.9 | 2.5 |
| September | 2.7 | 1.7 | 2.4 | 2.5 | 2.5 | 2.8 | 2.2 | 2.5 | 2.3 |
| December | 2.6 | 2.3 | 2.6 | 2.6 | 2.9 | 3.3 | 1.9 | 2.4 | 2.6 |
| 2005 | | | | | | | | | |
| March | 2.2 | 2.0 | 2.6 | 2.2 | 3.4 | 3.5 | 2.1 | 2.2 | 2.4 |
| June | 2.4 | 2.1 | 2.5 | 2.2 | 3.8 | 3.1 | 2.6 | 2.1 | 2.5 |
| September | 2.9 | 3.1 | 2.8 | 3.0 | 4.1 | 3.5 | 2.8 | 2.9 | 3.0 |
December
2006
March | 2.5
2.7 | 2.7
2.8 | 2.8
2.9 | 2.7
3.1 | 4.0
4.2 | 2.9
2.8 | 3.0
3.4 | 3.1
3.5 | 2.8
3.0 |
Percentage Change (from previous quarter) |
|
| 2002 | | | | | | | | | |
| March | 1.0 | 0.9 | 1.0 | 0.8 | 0.8 | 1.0 | 0.2 | 0.5 | 0.9 |
| June | 0.7 | 0.7 | 0.7 | 1.0 | 0.7 | 1.3 | 0.9 | 1.2 | 0.7 |
| September | 0.6 | 0.7 | 0.8 | 0.9 | 0.9 | 0.4 | 0.3 | 0.7 | 0.7 |
| December | 0.6 | 0.9 | 0.5 | 0.9 | 0.4 | 0.4 | 0.6 | 0.8 | 0.7 |
| 2003 | | | | | | | | | |
| March | 1.2 | 1.4 | 1.4 | 2.2 | 0.7 | 1.4 | 1.0 | 1.1 | 1.3 |
| June | 0.1 | 0.0 | 0.0 | -0.2 | 0.0 | 0.6 | 0.3 | 0.0 | 0.0 |
| September | 0.1 | 0.6 | 1.1 | 0.8 | 0.9 | 0.2 | -0.1 | 0.9 | 0.6 |
| December | 0.8 | 0.2 | 0.6 | 0.6 | 0.4 | 0.6 | 0.5 | 0.7 | 0.5 |
| 2004 | | | | | | | | | |
| March | 1.0 | 1.0 | 0.8 | 1.0 | 0.3 | 0.7 | 0.4 | 0.7 | 0.9 |
| June | 0.3 | 0.3 | 0.6 | 0.6 | 1.0 | 0.9 | 0.4 | 0.6 | 0.5 |
| September | 0.5 | 0.2 | 0.3 | 0.3 | 0.7 | 0.5 | 0.9 | 0.5 | 0.4 |
| December | 0.8 | 0.8 | 0.8 | 0.7 | 0.9 | 1.2 | 0.2 | 0.5 | 0.8 |
| 2005 | | | | | | | | | |
| March | 0.6 | 0.8 | 0.8 | 0.6 | 0.8 | 0.9 | 0.6 | 0.5 | 0.7 |
| June | 0.5 | 0.3 | 0.5 | 0.6 | 1.3 | 0.5 | 0.9 | 0.5 | 0.6 |
| September | 1.0 | 1.2 | 0.6 | 1.1 | 1.0 | 0.9 | 1.0 | 1.3 | 0.9 |
December
2006
March | 0.3
0.8 | 0.4
0.9 | 0.8
0.9 | 0.5
1.0 | 0.8
1.0 | 0.6
0.8 | 0.5
0.9 | 0.8
0.9 | 0.5
0.9 |
|
LONGER TERM SERIES:
CPI All Groups, Weighted Average of Eight Capital Cities, Index Numbers(a)
|
| | | | Quarter ending |
|
| Year | 31 March | 30 June | 30 September | 31 December |
|
| 1985 | 68.1 | 69.7 | 71.3 | 72.7 |
| 1986 | 74.4 | 75.6 | 77.6 | 79.8 |
| 1987 | 81.4 | 82.6 | 84.0 | 85.5 |
| 1988 | 87.0 | 88.5 | 90.2 | 92.0 |
| 1989 | 92.9 | 95.2 | 97.4 | 99.2 |
| 1990 | 100.9 | 102.5 | 103.3 | 106.0 |
| 1991 | 105.8 | 106.0 | 106.6 | 107.6 |
| 1992 | 107.6 | 107.3 | 107.4 | 107.9 |
| 1993 | 108.9 | 109.3 | 109.8 | 110.0 |
| 1994 | 110.4 | 111.2 | 111.9 | 112.8 |
| 1995 | 114.7 | 116.2 | 117.6 | 118.5 |
| 1996 | 119.0 | 119.8 | 120.1 | 120.3 |
| 1997 | 120.5 | 120.2 | 119.7 | 120.0 |
| 1998 | 120.3 | 121.0 | 121.3 | 121.9 |
| 1999 | 121.8 | 122.3 | 123.4 | 124.1 |
| 2000 | 125.2 | 126.2 | 130.9 | 131.3 |
| 2001 | 132.7 | 133.8 | 134.2 | 135.4 |
| 2002 | 136.6 | 137.6 | 138.5 | 139.5 |
| 2003 | 141.3 | 141.3 | 142.1 | 142.8 |
| 2004 | 144.1 | 144.8 | 145.4 | 146.5 |
2005
2006 | 147.5
151.9 | 148.4 | 149.8 | 150.6 |
|
| (a) Base of each index:1989-90 = 100.0 |
 Print Page
 Print All