CHANGES IN THIS ISSUE
The seasonally adjusted series have been updated following the normal annual review of the seasonal adjustment process.
INTRODUCTION
This quarterly article supplements information presented in the publication, Retail Trade, Australia (cat.no.8501.0). It presents information about Net proceeds received from licensed gambling activities (hereafter called Gambling) undertaken by businesses in the Pubs, taverns and bars and Clubs (hospitality) industries. These industries are called 'Hotels and licensed clubs' in Retail Trade, Australia.
Gambling includes:
- commission from TAB and Keno transactions
- net takings from Bingo
- net revenue received from poker machines and other electronic gaming machines.
For further background about the Gambling series, please refer to the feature article in the December 2002 issue of Retail Trade, Australia.
The gambling article will be released on the ABS Web Site once a quarter about a week after the release of the March, June, September and December issues of Retail Trade, Australia.
INQUIRIES
For further information about these and related statistics, contact the National Information and Referral Service on 1300 135 070.
SUMMARY COMMENTARY
FINDINGS
It can be seen from Table 1, that for each quarter, the rate of quarterly growth can vary between the Gambling, Hotels and licensed clubs and Total retail series. Over the period from September quarter 2003 to September quarter 2005, the Total retail series grew by 10.1%, Hotels and licensed clubs grew by 12.5% and Gambling grew by 18.8%.
1. GAMBLING IN RETAIL TRADE, AUSTRALIA, SEASONALLY ADJUSTED |
|  |
 |  | Gambling | Hotels and licensed clubs | Total Retail |  |
 |  | Net proceeds | Percentage change | Turnover | Percentage change | Turnover | Percentage change |  |
| Quarter | $m | % | $m | % | $m | % |  |
|  |
| 2003 |  |  |  |  |  |  |  |
 | September | 1 538.9 | -1.2 | 4 209.4 | 1.3 | 46 820.0 | 2.4 |  |
 | December | 1 575.9 | 2.4 | 4 292.2 | 2.0 | 48 070.0 | 2.7 |  |
| 2004 |  |  |  |  |  |  |  |
 | March | 1 566.8 | -0.6 | 4 325.3 | 0.8 | 49 088.6 | 2.1 |  |
 | June | 1 611.8 | 2.9 | 4 378.6 | 1.2 | 49 428.3 | 0.7 |  |
 | September | 1 615.7 | 0.2 | 4 340.5 | -0.9 | 50 042.1 | 1.2 |  |
 | December | 1 703.8 | 5.5 | 4 439.0 | 2.3 | 50 138.6 | 0.2 |  |
| 2005 |  |  |  |  |  |  |  |
 | March | 1 783.4 | 4.7 | 4 415.8 | -0.5 | 50 206.9 | 0.1 |  |
 | June | 1 888.0 | 5.9 | 4 674.7 | 5.9 | 50 882.5 | 1.3 |  |
 | September | 1 827.9 | -3.2 | 4 733.6 | 1.3 | 51 549.1 | 1.3 |  |
|  |
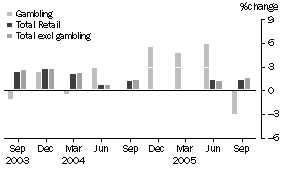
Graph 2 compares the growth rates of Gambling, Total retail and Total retail adjusted to exclude gambling (although other turnover for Hotels and licensed clubs is included). This shows that Total retail and Total retail excluding gambling generally grow at a similar rate. This reflects the low contribution of gambling to Total retail indicated in Table 3.
2. PERCENTAGE CHANGE IN QUARTERLY TURNOVER, Seasonally Adjusted

Table 3 shows that gambling remained a relatively stable proportion of both turnover for Hotels and licensed clubs and Total retail up to December 2004. After a small increase in gambling as a percentage of Total Retail turnover and of Hotels and licensed clubs in both March and June quarters 2005, there has been a small decrease in gambling as a percentage of Total Retail turnover and of Hotels and licensed clubs for September quarter 2005.
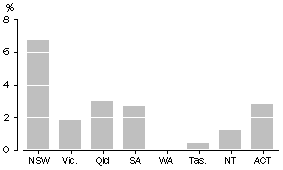
From Graph 4 it can be seen that in September quarter 2005, gambling as a proportion of state turnover is highest in New South Wales and Queensland and lowest in Western Australia and Tasmania.
4. CONTRIBUTION OF GAMBLING TO TOTAL TURNOVER, Seasonally Adjusted - September Quarter 2005

This needs to be considered in the context of the varying state restrictions on gaming machines. Table 5 shows that gambling as a proportion of state turnover for the period September 2003 to September 2005 has been reasonably consistent although there has been some volatility through the quarters.
5. CONTRIBUTION OF GAMBLING TO TOTAL TURNOVER, BY STATE, SEASONALLY ADJUSTED |
|  |
 |  | New South Wales | Victoria | Queensland | South Australia | Western Australia | Tasmania | Northern Territory | Australian Capital Territory |  |
| Quarter | % | % | % | % | % | % | % | % |  |
|  |
| 2003 |  |  |  |  |  |  |  |  |  |
 | September | 6.1 | 1.3 | 2.9 | 3.3 | 0.0 | 0.5 | 1.4 | 2.9 |  |
 | December | 6.2 | 1.3 | 2.6 | 3.5 | 0.0 | 0.4 | 1.3 | 2.8 |  |
| 2004 |  |  |  |  |  |  |  |  |  |
 | March | 6.1 | 1.3 | 2.5 | 3.3 | 0.0 | 0.5 | 1.3 | 2.8 |  |
 | June | 6.3 | 1.3 | 2.6 | 3.3 | 0.0 | 0.4 | 1.1 | 2.8 |  |
 | September | 6.4 | 1.2 | 2.3 | 3.1 | 0.0 | 0.4 | 1.1 | 2.9 |  |
 | December | 6.8 | 1.5 | 2.4 | 2.9 | 0.0 | 0.5 | 1.0 | 2.6 |  |
| 2005 |  |  |  |  |  |  |  |  |  |
 | March | 7.0 | 1.5 | 2.7 | 2.9 | 0.0 | 0.5 | 0.6 | 2.6 |  |
 | June | 7.2 | 1.8 | 3.0 | 2.9 | 0.0 | 0.5 | 1.0 | 2.8 |  |
 | September | 6.7 | 1.8 | 3.0 | 2.7 | 0.0 | 0.4 | 1.2 | 2.8 |  |
|  |
SAMPLING ERRORS
Standard errors for the level estimate for Australia (original data) are shown below. The standard error associated with the seasonally adjusted series is approximately the same as for the original estimates.
6. STANDARD ERRORS |
|  |
 |  | Estimate | Standard error | Relative Standard error |  |
| Data series | $m | $m | % |  |
|  |
| Net proceeds from gambling |  |  |  |  |
 | September quarter 2005 | 1 895.9 | 64.0 | 3.4 |  |
|  |
FURTHER INFORMATION
For further information about these and related statistics, contact Jeremy Walker on (02) 6252 5451.
RELATED INFORMATION
The ABS produces a more comprehensive range of data on gambling via its service industries program. Detailed surveys of the Pubs, taverns and bars industry, Clubs industry and Casino industry are usually conducted every three years.
 Print Page
 Print All