At the end of 2017-18, there were 2,313,291 actively trading businesses in the market sector in Australia, an increase of 3.4% (74,992 businesses) from the end of 2016-17.
During this period, the rates of businesses entering the market sector in Australia (15.8%), and those exiting (12.5%), were higher than in the previous year (15.1% and 12.0%, respectively).
Construction (Division E) continues to be the industry with the largest number of businesses in Australia in 2017-18, accounting for 16.6% or 383,326 of all businesses.
One-third (33.7%) of the annual increase in businesses in Australia is due to growth in the Transport, Postal and Warehousing industry (Division I), which increased by 16.8% (25,247 businesses).
The Transport, Postal and Warehousing industry also had the highest rate for businesses entering (33.6%) the Australian economy in 2017-18.
The annual growth in Transport, Postal and Warehousing businesses during 2017-18 is driven by the following Industry Classes: ‘Taxi and Other Road Transport’, which increased 39.1% (9,899 businesses; Class 4623) and ‘Other Transport Support Services n.e.c.’, which increased 29.4% (11,801 businesses; Class 5299). Together, these Industry Classes account for 86% of the growth in Division I. This growth has continued since 2015 when legislation was passed requiring ride share drivers to register as businesses.
Two industry divisions showed an annual decrease in business counts in 2017-18:
Agriculture, Forestry and Fishing (Division A) showed the largest decrease from 2016-17 (down 0.9% or 1,634 businesses) as well as the lowest entry rate (7.2%) of businesses in 2017-18.
Mining (Division B) showed an annual decrease of 0.5% (37 businesses).
A - Agriculture, Forestry and Fishing; B - Mining; C - Manufacturing; D - Electricity, Gas, Water and Waste Services; E - Construction; F - Wholesale Trade; G - Retail Trade; H - Accommodation and Food Services; I - Transport, Postal and Warehousing; J - Information Media and Telecommunications; K - Financial and Insurance Services; L - Rental, Hiring and Real Estate Services; M - Professional, Scientific and Technical Services; N - Administrative and Support Services; O - Public Administration and Safety; P - Education and Training; Q - Health Care and Social Assistance; R - Arts and Recreation Services; S - Other Services
MAIN STATE OF OPERATION
Key Findings
In 2017-18, almost two-thirds (60.6%) of all businesses in Australia were in New South Wales (NSW, 783,050 businesses) and Victoria (618,189 businesses).
Over this period, the number of businesses increased in all States and Territories (Main State); businesses in NSW (up 29,268 businesses) and Victoria (up 27,353 businesses) accounted for 75.5% of annual growth.
In 2017-18, the largest annual percentage increase was in Victoria (up 4.6%; or 27,353 businesses), followed by the Australian Capital Territory (ACT, up 4.3%; or 1,190 businesses) and NSW (up 3.9%; or 29,268 businesses).
Businesses in the ACT had both the highest entry (18.0%)and exit rates (13.4%) in 2017-18.
Businesses in Tasmania had both the lowest entry (11.8%) and exit (10.2%) rates in 2017-18.
Of the 2,313,291 businesses operating at the end of 2017-18, Households continued to be the largest Institutional Sector (55.4%; 1,280,627 businesses).
During 2017-18, all Institutional Sectors recorded growth.
Financial Corporations (up 3.8%; or 7,215 businesses) showed the largest percentage increase over this period.
Households had the highest entry rate (16.3%) and exit rate (13.1%) in 2017-18.
Of those businesses operating at 30 June 2014, Financial Corporations had the highest survival rate (72.7%) at 30 June 2018.
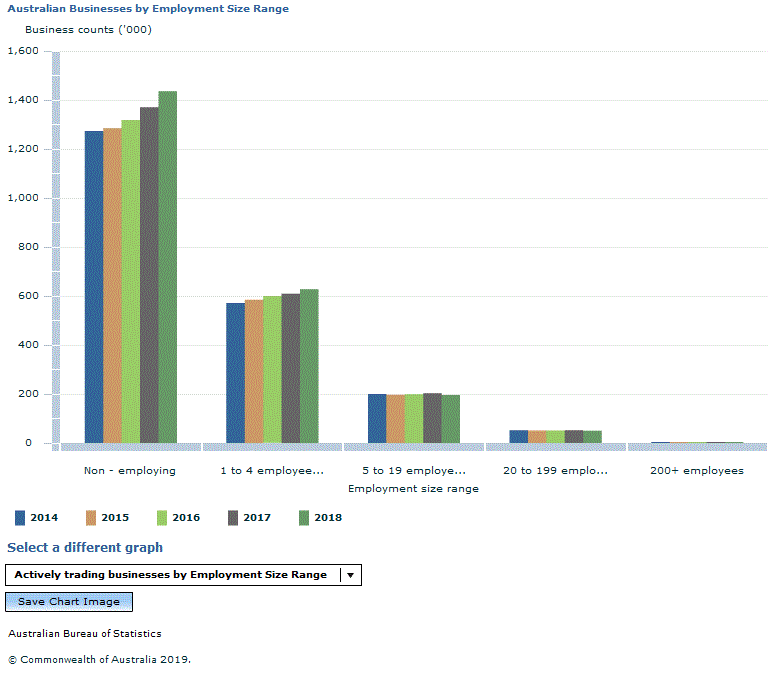
In 2017-18, almost two-thirds of businesses in Australia (62.1%; or 1,435,547 businesses) were non-employing. Non-employing businesses also had the largest increase (up 4.8%; or 65,496 businesses) in 2017-18.
Over one-third of all businesses in Australia in 2017-18 were employing (37.9%; or 877,744 businesses).
The most common employing businesses had between 1 and 4 employees (71.5%; or 627,932 businesses).
The least common employing businesses had 200 or more employees (0.4%; or 3,855 businesses).
Businesses with 1-4 employees showed the largest annual increase of all employing businesses (up 3.2% or 19,199 businesses).
Businesses in the larger employment size ranges all decreased. Businesses with 5-19 employees showed the largest decrease (down 3.8%, or 7,732 businesses).
During 2017-18, there was a net movement of businesses away from all employing size categories; 1-4 (-8,442), 5-19 (-4,895), 20-199 (-1,089) and 200+ (-12), to the Non-employing category (14,438).
In 2017-18, non-employing businesses had both the highest entry (19.0%) and exit (15.2%) rates, while businesses with 20-199 employees had both the lowest entry (2.2%) and exit (3.7%) rates.
Of those businesses operating in June 2014, non-employing businesses had the lowest survival rate at 30 June 2018 (59.6%); while businesses with 200+ employees had the highest survival rate (85.6%) at 30 June 2018.
In terms of survival, for businesses that entered the market sector during 2014-15, non-employing businesses had the lowest survival rate (50.6%), whilst businesses employing 200+ employees had the highest survival rate (73.9%).
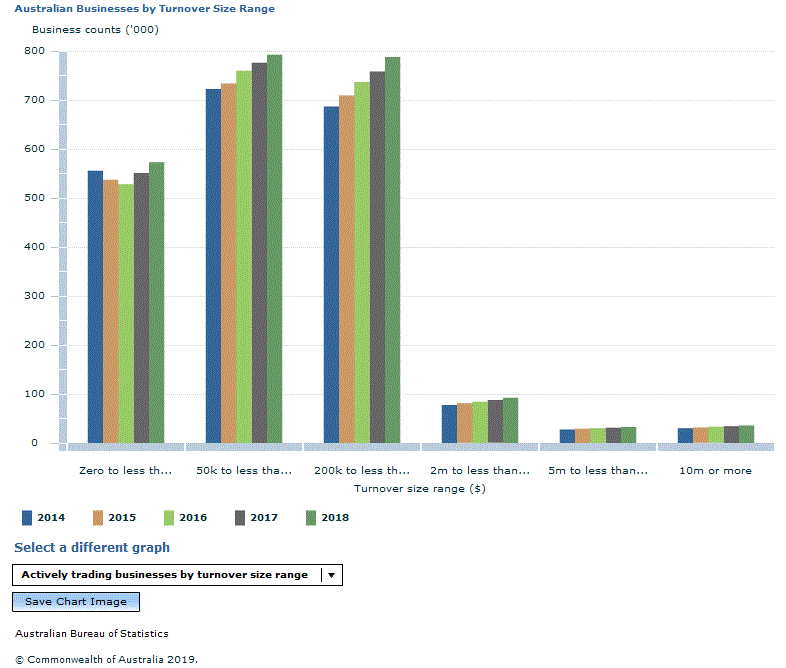
Of the 2,313,291 actively trading businesses operating at the end of 2017-18, most (93.1% or 2,152,884) had annual turnover of less than $2m.
Businesses with annual turnover $2m to less than $5m had the largest annual percentage increase (5.3%) in 2017-18, while businesses with turnover of $50k to less than $200k had the smallest annual percentage increase (2.1%).
In 2017-18, businesses with turnover from $50k to less than $200k had the highest entry rate (20.6%) and businesses with less than $50k had the highest exit rate (19.4%).
During 2017-18, the largest net movement was away from businesses in the $50k to less than $200k turnover size range (-36,869).
Of those businesses operating in June 2014, survival rates at June 2018 generally increased with increasing annual turnover. The exception to this is businesses with turnover of $10m or more. The survival rate of these businesses (83.5%) is lower than for businesses with a turnover of $5m to $10m (84.2%).
For businesses that entered the market sector during 2014-15, businesses in the two lowest turnover size ranges (Zero to less than $50k and $50k to less than $200k) had the lowest survival rate (51.8%). Businesses with turnover of $5m to less than $10m had the highest survival rate (66.8%).
 Quality Declaration
  Print Page
 Print All