CONSUMPTION
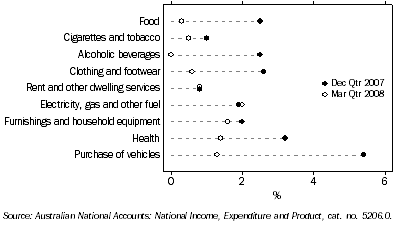
Household final consumption expenditure, (from Table 3.1) Seasonally adjusted
- Chain volume measures
: Quarterly % change

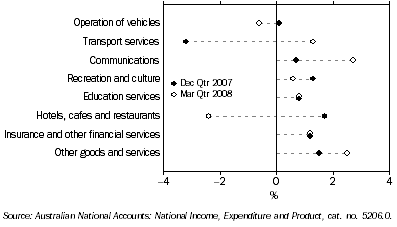
Household final consumption expenditure, (from Table 3.1) Seasonally adjusted
- Chain volume measures
: Quarterly % change

Household final consumption expenditure, Chain volume measures(a) |
|  |
| Period | Food | Cigarettes and tobacco | Alcoholic beverages | Clothing and footwear | Rent and other dwelling services | Electricity, gas and other fuel | Furnishings and household equipment | Health | Purchase of vehicles | Operation of vehicles | Transport services | Commun-
ications | Recreation and culture | Education services | Hotels, cafes and restaurants | Insurance and other financial services | Other goods and services | Total |  |
ANNUAL ($ MILLION) |  |
|  |
| 2004-05 | 58 959 | 10 682 | 10 908 | 19 355 | 91 900 | 10 960 | 29 023 | 27 600 | 19 875 | 33 336 | 12 930 | 14 783 | 62 665 | 18 136 | 40 622 | 37 113 | 35 059 | 533 641 |  |
| 2005-06 | 59 868 | 10 340 | 11 265 | 20 119 | 95 229 | 11 235 | 29 657 | 28 234 | 20 298 | 31 637 | 13 016 | 15 690 | 65 810 | 18 649 | 41 959 | 38 753 | 35 698 | 547 457 |  |
| 2006-07 | 61 657 | 10 027 | 11 708 | 21 332 | 98 326 | 11 615 | 31 928 | 29 286 | 21 374 | 32 332 | 13 820 | 15 779 | 68 636 | 19 206 | 43 441 | 40 454 | 38 218 | 569 138 |  |
PERCENTAGE CHANGE FROM PREVIOUS YEAR |  |
|  |
| 2004-05 | 2.8 | 2.6 | 9.0 | 8.7 | 3.7 | 1.1 | 6.6 | 4.3 | 5.3 | 5.0 | 7.7 | 7.8 | 4.5 | 1.7 | 3.1 | 4.1 | 4.8 | 4.4 |  |
| 2005-06 | 1.5 | -3.2 | 3.3 | 3.9 | 3.6 | 2.5 | 2.2 | 2.3 | 2.1 | -5.1 | 0.7 | 6.1 | 5.0 | 2.8 | 3.3 | 4.4 | 1.8 | 2.6 |  |
| 2006-07 | 3.0 | -3.0 | 3.9 | 6.0 | 3.3 | 3.4 | 7.7 | 3.7 | 5.3 | 2.2 | 6.2 | 0.6 | 4.3 | 3.0 | 3.5 | 4.4 | 7.1 | 4.0 |  |
SEASONALLY ADJUSTED ($ MILLION) |  |
|  |
| 2005-2006 |  |  |  |  |  |  |  |  |  |  |  |  |  |  |  |  |  |  |  |
 | March | 14 951 | 2 542 | 2 825 | 5 027 | 23 913 | 2 825 | 7 385 | 7 034 | 5 028 | 8 011 | 3 233 | 3 944 | 16 567 | 4 681 | 10 545 | 9 728 | 8 940 | 137 158 |  |
 | June | 15 109 | 2 502 | 2 844 | 5 146 | 24 136 | 2 894 | 7 604 | 7 087 | 5 068 | 7 800 | 3 314 | 3 935 | 16 713 | 4 713 | 10 664 | 9 860 | 9 083 | 138 552 |  |
| 2006-2007 |  |  |  |  |  |  |  |  |  |  |  |  |  |  |  |  |  |  |  |
 | September | 15 193 | 2 474 | 2 863 | 5 228 | 24 275 | 2 869 | 7 780 | 7 143 | 5 101 | 7 983 | 3 368 | 3 883 | 16 834 | 4 753 | 10 668 | 9 963 | 9 126 | 139 504 |  |
 | December | 15 370 | 2 478 | 2 907 | 5 308 | 24 478 | 2 898 | 7 923 | 7 297 | 5 207 | 8 015 | 3 454 | 3 934 | 17 078 | 4 786 | 10 861 | 10 054 | 9 671 | 141 721 |  |
 | March | 15 594 | 2 526 | 2 959 | 5 342 | 24 687 | 2 910 | 8 064 | 7 388 | 5 470 | 8 136 | 3 446 | 3 971 | 17 231 | 4 823 | 10 984 | 10 157 | 9 693 | 143 380 |  |
 | June | 15 500 | 2 548 | 2 979 | 5 454 | 24 885 | 2 938 | 8 160 | 7 458 | 5 596 | 8 198 | 3 552 | 3 991 | 17 493 | 4 844 | 10 928 | 10 280 | 9 729 | 144 532 |  |
| 2007-2008 |  |  |  |  |  |  |  |  |  |  |  |  |  |  |  |  |  |  |  |
 | September | 15 438 | 2 588 | 3 023 | 5 592 | 25 031 | 2 993 | 8 328 | 7 542 | 5 540 | 8 287 | 3 561 | 3 973 | 18 159 | 4 866 | 11 049 | 10 394 | 9 850 | 146 213 |  |
 | December | 15 830 | 2 614 | 3 100 | 5 739 | 25 231 | 3 050 | 8 490 | 7 784 | 5 838 | 8 294 | 3 446 | 4 002 | 18 390 | 4 904 | 11 236 | 10 520 | 9 996 | 148 465 |  |
 | March | 15 881 | 2 628 | 3 099 | 5 771 | 25 435 | 3 112 | 8 629 | 7 890 | 5 913 | 8 246 | 3 490 | 4 110 | 18 506 | 4 941 | 10 964 | 10 648 | 10 245 | 149 506 |  |
PERCENTAGE CHANGE FROM PREVIOUS QUARTER |  |
|  |
| 2006-2007 |  |  |  |  |  |  |  |  |  |  |  |  |  |  |  |  |  |  |  |
 | December | 1.2 | 0.2 | 1.5 | 1.5 | 0.8 | 1.0 | 1.8 | 2.2 | 2.1 | 0.4 | 2.6 | 1.3 | 1.5 | 0.7 | 1.8 | 0.9 | 6.0 | 1.6 |  |
 | March | 1.5 | 2.0 | 1.8 | 0.6 | 0.9 | 0.4 | 1.8 | 1.2 | 5.0 | 1.5 | -0.2 | 0.9 | 0.9 | 0.8 | 1.1 | 1.0 | 0.2 | 1.2 |  |
 | June | -0.6 | 0.8 | 0.7 | 2.1 | 0.8 | 0.9 | 1.2 | 0.9 | 2.3 | 0.8 | 3.1 | 0.5 | 1.5 | 0.4 | -0.5 | 1.2 | 0.4 | 0.8 |  |
| 2007-2008 |  |  |  |  |  |  |  |  |  |  |  |  |  |  |  |  |  |  |  |
 | September | -0.4 | 1.6 | 1.5 | 2.5 | 0.6 | 1.9 | 2.1 | 1.1 | -1.0 | 1.1 | 0.3 | -0.4 | 3.8 | 0.5 | 1.1 | 1.1 | 1.2 | 1.2 |  |
 | December | 2.5 | 1.0 | 2.5 | 2.6 | 0.8 | 1.9 | 2.0 | 3.2 | 5.4 | 0.1 | -3.2 | 0.7 | 1.3 | 0.8 | 1.7 | 1.2 | 1.5 | 1.5 |  |
 | March | 0.3 | 0.5 | 0.0 | 0.6 | 0.8 | 2.0 | 1.6 | 1.4 | 1.3 | -0.6 | 1.3 | 2.7 | 0.6 | 0.8 | -2.4 | 1.2 | 2.5 | 0.7 |  |
|  |
| (a) Reference year 2005-06. |
| Source: Australian National Accounts: National Income, Expenditure and Product, cat. no. 5206.0 |