EXPENDITURE
Recurrent expenditure for Acute and psychiatric hospitals during 2011-12 amounted to $9,339 million, up 4.4% from 2010-11.
Wages and salaries (including on-costs such as employer contributions to superannuation and payroll tax) represented 48.6% of recurrent expenditure in 2011-12, down from 50.6% in 2010-11. Western Australia recorded the highest proportion of total recurrent expenditure that was spent on wages and salaries, at 51.9%, while New South Wales had the lowest proportion, at 45.8%.
The next largest component of recurrent expenditure was Drug, medical, pharmaceutical and surgical supplies, which accounted for 27.5% of the total.
The average expenditure per patient day was $1,158 in 2011-12 compared with $1,123 in 2010-11.
Table 2.15 PRIVATE ACUTE AND PSYCHIATRIC HOSPITALS, Expenditure —State and territories - 2011-12
|
 | | NSW | Vic. | Qld | SA | WA | Tas., NT &
ACT(a) | Aus. |
|
| Expenditure ($'000)(b) | | | | | | | |
| Labour costs, including on-costs | | | | | | | |
| | Wages and salaries, including on-costs | 1 160 008 | 1 207 869 | 1 061 106 | np | 648 032 | np | 4 539 529 |
| | Contract/consultancy payments for medical/health services | 102 183 | 81 967 | 59 066 | np | 75 284 | np | 345 028 |
| Drug, medical, pharmaceuticals and surgical supplies(c) | 762 482 | 650 386 | 587 870 | np | 285 239 | np | 2 570 375 |
| Food supplies | 34 318 | 33 820 | 35 506 | np | 18 142 | np | 131 984 |
| Repair and maintenance | 35 442 | 22 242 | 33 460 | np | 16 469 | np | 117 286 |
| Fuel and power | 27 826 | 22 770 | 22 831 | np | 14 261 | np | 99 692 |
| Patient transport | 918 | 6 330 | 204 | np | 1 645 | np | 10 115 |
| Depreciation and amortisation | 86 112 | 80 370 | 88 665 | np | 40 477 | np | 321 947 |
| Interest | 14 575 | 6 576 | 13 655 | np | 2 855 | np | 47 052 |
| Non-labour contract expenses | 83 429 | 127 277 | 72 117 | np | 28 623 | np | 345 862 |
| Other (d) | 205 235 | 191 725 | 137 268 | np | 106 952 | np | 718 799 |
| Total (e) | 2 532 065 | 2 450 151 | 2 152 145 | np | 1 248 069 | np | 9 339 217 |
|
| Wages and salaries, including on-costs, as a proportion of total expenditure (%) | 45.8 | 49.3 | 49.3 | np | 51.9 | np | 48.6 |
| Average expenditure ($)(f) |
| Per patient separation | 3 043 | 3 260 | 3 207 | np | 3 299 | np | 3 149 |
| Per patient day | 1 148 | 1 139 | 1 115 | np | 1 346 | np | 1 158 |
|
| Gross Capital expenditure ($'000)(g) | | | | | | | |
| Land and buildings | np | np | np | np | np | np | np |
| Major medical equipment | np | np | np | np | np | np | np |
| Information technology | np | np | np | np | np | np | np |
| Other capital expenditure | np | np | np | np | np | np | np |
| Total (e) | np | np | np | np | np | np | np |
| Net Capital expenditure ($'000)(g) |
| Land and buildings | np | np | np | np | np | np | np |
| Major medical equipment | np | np | np | np | np | np | np |
| Information technology | np | np | np | np | np | np | np |
| Other capital expenditure | np | np | np | np | np | np | np |
| Total (e) | np | np | np | np | np | np | np |
|
np not available for publication but included in totals where applicable, unless otherwise indicated
(a) Tasmania, the Northern Territory and the Australian Capital Territory have been aggregated to protect the confidentiality of the small number of hospitals in these states/territories.
(b) Expenditure refers to expenditure on goods and services, which does not result in the creation or acquisition of fixed assets (new or second-hand). See Glossary for further information.
(c) Including surgically implanted prostheses and homograft items.
(d) Including contract services.
(e) Figures have been rounded and discrepancies may occur between totals and the sums of the component items.
(f) Average expenditure figures can vary considerably between hospitals depending on the type of services they provide.
(g) Capital expenditure refers to expenditure in a period on the acquisition or enhancement of an asset (excluding financial assets). See Glossary for further information. Note that gross and net capital expenditure has not been published for 2011-12. See Explanatory Note 40 for further information. |
For profit hospitals had a lower average expenditure per patient day ($1,042) than Religious or charitable Not for profit hospitals ($1,321) and Other Not for profit hospitals ($1,201) in 2011-12.
For profit hospitals and Religious or charitable Not for profit hospitals spent a slightly higher proportion of their total expenditure on wages and salaries (49.0% and 48.5% respectively) than the Other Not for profit hospitals (47.3%).
Table 2.16 PRIVATE ACUTE AND PSYCHIATRIC HOSPITALS, Expenditure — For profit/not for profit sector (a) - 2011-12
|
| | | | | | |
| | | For profit | Religious or charitable | Other (b) | Total |
|
| Expenditure ($'000)(c) | | | | |
| Labour costs, including on-costs | | | | |
| | Wages and salaries, including on-costs | 2 259 539 | 1 892 822 | 387 168 | 4 539 529 |
| | Contract/consultancy payments for medical/health services | 228 546 | 92 254 | 24 228 | 345 028 |
| Drug, medical, pharmaceuticals and surgical supplies(d) | 1 245 879 | 1 084 835 | 239 661 | 2 570 375 |
| Food supplies | np | 59 880 | np | 131 984 |
| Repair and maintenance | 62 924 | 47 926 | 6 436 | 117 286 |
| Fuel and power | 49 271 | 42 694 | 7 727 | 99 692 |
| Patient transport | np | 1 402 | np | 10 115 |
| Depreciation and amortisation | 137 885 | 162 409 | 21 653 | 321 947 |
| Interest | np | 25 970 | np | 47 052 |
| Non-labour contract expenses | np | 147 663 | np | 345 862 |
| Other (e) | 371 758 | 291 475 | 55 566 | 718 799 |
| Total (f) | 4 614 404 | 3 906 320 | 818 493 | 9 339 217 |
|
| Wages and salaries, including on-costs, as a proportion of total expenditure (%) | 49.0 | 48.5 | 47.3 | 48.6 |
| Average expenditure ($)(g) |
| Per patient separation | 2 791 | 3 626 | 3 485 | 3 149 |
| Per patient day | 1 042 | 1 321 | 1 201 | 1 158 |
|
| Gross Capital expenditure ($'000)(h) | np | np | np | np |
| Land and buildings | np | np | np | np |
| Major medical equipment | np | np | np | np |
| Information technology | np | np | np | np |
| Other capital expenditure | np | np | np | np |
| Total (f) | | | | |
| Net Capital expenditure ($'000)(h) |
| Land and buildings | np | np | np | np |
| Major medical equipment | np | np | np | np |
| Information technology | np | np | np | np |
| Other capital expenditure | np | np | np | np |
| Total (f) | np | np | np | np |
|
np not available for publication but included in totals where applicable, unless otherwise indicated
(a) For definition of 'For Profit/not for profit sector', see Glossary.
(b) Comprising bush nursing, community and memorial hospitals.
(c) Expenditure refers to expenditure on goods and services, which does not result in the creation or acquisition of fixed assets (new or second-hand). See Glossary for further information.
(d) Including surgically implanted prostheses and homograft items.
(e) Including contract services
(f) Total may include figures where providers were able to provide a total expenditure figure, without further breakdown of expenditure items, therefore the total will not equate to the sum of the individual items.
(g) Average expenditure figures can vary considerably between hospitals depending on the type of services they provide.
(h) Capital expenditure refers to expenditure in a period on the acquisition or enhancement of an asset (excluding financial assets). See Glossary for further information. Note that gross and net capital expenditure has not been published for 2011-12. See Explanatory Note 40 for further information. |
The average cost per patient day increased as hospital size increased, with the exception of the 0-25 bed hospitals. This reflects the greater complexity of procedures undertaken at the larger hospitals. In 2011-12, recurrent expenditure per patient day (unadjusted for price changes) at Acute and psychiatric hospitals with over 200 beds was $1,389 compared with an average of $720 for hospitals with 26-50 beds.
The proportion of total expenditure that is spent on wages and salaries varied from 46.0% of expenditure for hospitals with 101- 200 beds, to 53.7% of expenditure for hospitals with 51-100 beds.
Table 2.17 PRIVATE ACUTE AND PSYCHIATRIC HOSPITALS, Expenditure —Hospital size (a) - 2011-12
|
| | | Number of beds |
| | | 0-25 | 26-50 | 51-100 | 101-200 | Over 200 | Total (e) |
|
| Expenditure ($'000)(b) | | | | | | |
| Labour costs, including on-costs | | | | | | |
| | Wages and salaries, including on-costs | 65 096 | 227 832 | 887 569 | 1 393 700 | 1 965 332 | 4 539 529 |
| | Contract/consultancy payments for medical/health services | 4 751 | 15 772 | 58 658 | 120 963 | 144 884 | 345 028 |
| Drug, medical, pharmaceuticals and surgical supplies(c) | 28 181 | 70 415 | 382 098 | 875 809 | 1 213 872 | 2 570 375 |
| Food supplies | 1 926 | 7 942 | 25 137 | 38 135 | 58 844 | 131 984 |
| Repair and maintenance | 1 717 | 7 162 | 24 484 | 33 486 | 50 437 | 117 286 |
| Fuel and power | 2 113 | 5 995 | 20 334 | 28 896 | 42 354 | 99 692 |
| Patient transport | 126 | 438 | 1 251 | 5 205 | 3 095 | 10 115 |
| Depreciation and amortisation | 3 900 | 14 485 | 62 628 | 97 794 | 143 140 | 321 947 |
| Interest | 1 409 | 4 567 | 9 889 | 24 726 | 6 461 | 47 052 |
| Non-labour contract expenses | 6 313 | 27 971 | 53 803 | 114 884 | 142 891 | 345 862 |
| Other (d) | 17 273 | 43 645 | 114 755 | 263 456 | 279 670 | 718 799 |
| Total (e) | 133 468 | 432 536 | 1 651 604 | 3 030 641 | 4 090 968 | 9 339 217 |
|
| Wages and salaries, including on-costs, as a proportion of total expenditure (%) | 48.8 | 52.7 | 53.7 | 46.0 | 48.0 | 48.6 |
| Average expenditure ($)(f) |
| Per patient separation | 2 227 | 2 025 | 2 278 | 3 232 | 3 975 | 3 149 |
| Per patient day | 1 011 | 720 | 865 | 1 223 | 1 389 | 1 158 |
|
| Gross Capital expenditure ($'000)(g) |
| Land and buildings | np | np | np | np | np | np |
| Major medical equipment | np | np | np | np | np | np |
| Information technology | np | np | np | np | np | np |
| Other capital expenditure | np | np | np | np | np | np |
| Total (e) | np | np | np | np | np | np |
| Net Capital expenditure ($'000)(g) |
| Land and buildings | np | np | np | np | np | np |
| Major medical equipment | np | np | np | np | np | np |
| Information technology | np | np | np | np | np | np |
| Other capital expenditure | np | np | np | np | np | np |
| Total (e) | np | np | np | np | np | np |
|
np not available for publication but included in totals where applicable, unless otherwise indicated
(a) Based on number of available beds (average for the year).
(b) Refers to expenditure on goods and services, which does not result in the creation or acquisition of fixed assets (new or second-hand). See Glossary for further information.
(c) Including surgically implanted prostheses and homograft items.
(d) Including contract services.
(e) Figures have been rounded and discrepancies may occur between totals and the sums of the component items.
(f) Average expenditure figures can vary considerably between hospitals depending on the type of services they provide.
(g) Capital expenditure refers to expenditure in a period on the acquisition or enhancement of an asset (excluding financial assets). See Glossary for further information. Note that gross and net capital expenditure has not been published for 2011-12. See Explanatory Note 40 for further information. |
When recurrent expenditure is adjusted to remove the effects of price changes over the period, the average annual increase over the five years from 2006-07 ($7,362 million) to 2011-12 ($9,120 million) was 4.4% (see graph in Income section). For further information on the use of chain volume measures to adjust income and expenditure, see
Explanatory Note 26.
When average expenditure per patient day is adjusted to remove the effects of price changes over the period, the average annual increase over the five years from 2006-07 ($1,046) to 2010-11 ($1,131) was 1.6%.
Acute and Psychiatric Private Hospitals, Expenditure (a) per patient
day
: 2006-07 to 2011-12(b)
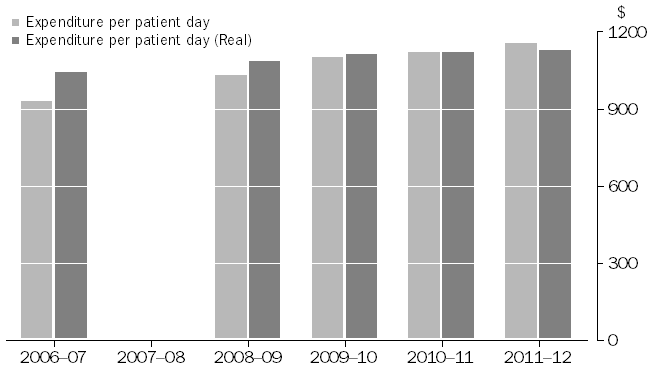 (a) Laspeyres input cost index was used to provide real expenditure. See Explanatory Note 26 for further information.
(b) Data for the 2007–08 reference year are not available. See Explanatory Note 4 for further information.
(a) Laspeyres input cost index was used to provide real expenditure. See Explanatory Note 26 for further information.
(b) Data for the 2007–08 reference year are not available. See Explanatory Note 4 for further information.
 Quality Declaration
  Print Page
 Print All