INTERNATIONAL STUDENTS AND THE MOST RECENT DIAC DATA AVAILABLE
The Australian Migration Program is administered by the Department of Immigration and Citizenship (DIAC). The program changes over time, as do the 'push' and 'pull' factors for migrants throughout the world. As recently as 16 December 2010, Senator Chris Evans and Minister Chris Bowen MP announced an Australian Government review of the student visa program, with the report due in mid-2011.
'The review is tasked with enhancing the continued competitiveness of the international education sector, as well as strengthening the integrity of the Student visa program.'(footnote 1)
Student applications granted
Recent data from DIAC were released in the Student visa program report 2010-11 to December 2010 and include time series data to December 2010, 18 months after the reference period of the majority of ABS final NOM data discussed in this article. In this report, DIAC advises that:
'Data can be dynamic and there can be delays in transmission of information from the department's global operations. Variations in figures between this report and previous issues can occur. Due to these issues, the current financial year should always be considered provisional.'(footnote 2)
In addition to this, each quarter DIAC release the Student Visa Program Quarterly Report with the most recent being 31 March 2011. This report is a valuable resource for anyone who have an interest in the international student sector.
Table 6.18 shows a fall in the number of international student visa applications granted in 2009-10 (270,500 persons). Over the period 2004-05 to 2008-09, DIAC recorded strong growth in the numbers of student visas being granted. In 2008-09, international student applications granted rose to a peak of 319,600 persons or 15% higher than the previous year (2007-08). A year later in 2009-10, the number of student applications granted had fallen 15% to 270,500 persons.
The student program administered by DIAC comprises seven subclasses that broadly reflect Australia's education sectors. Between 2004-05 and 2008-09, the higher education sector and the VET sector remained the largest two visa subclasses granted, averaging around 46% and 23% respectively over the period. The proportion of higher education sector visas, while showing some minor fluctuations, remained relatively stable. However, the VET sector more than doubled, increasing each year from 14% in 2004-05 to 32% in 2008-09.
6.18 STUDENT APPLICATIONS GRANTED, Student visa subclass - 2004-05 to 2009-10 |
|
 | | 2004-05 | 2005-06 | 2006-07 | 2007-08 | 2008-09 | 2009-10 |
|
| Student visa subclass(%) | | | | | | |
| 570-ELICOS(a) | 12.8 | 14.0 | 13.1 | 11.0 | 11.4 | 13.0 |
| 571-Schools | 7.2 | 6.6 | 7.1 | 6.1 | 4.4 | 4.6 |
| 572-VET(b) | 14.4 | 15.7 | 19.0 | 24.6 | 32.5 | 26.6 |
| 573-Higher education(c) | 47.1 | 49.1 | 48.5 | 46.8 | 41.9 | 44.0 |
| 574-Postgraduate research(c) | 6.3 | 2.9 | 2.5 | 2.5 | 2.6 | 3.5 |
| 575-Non-award(d) | 10.1 | 9.3 | 7.7 | 7.5 | 5.9 | 6.7 |
| 576-AusAID/Defence | 2.0 | 2.4 | 2.0 | 1.6 | 1.3 | 1.6 |
| Total (no.) | 175 818 | 191 347 | 230 807 | 278 715 | 319 632 | 270 499 |
|
| (a) English Language Intensive Courses for Overseas Students. |
| (b) Vocational Education and Training. |
| (c) Due to legislative change, from 1 July 2004, the Masters by Coursework qualification moved from the Postgraduate Research Sector to the Higher Education Sector. |
| (d) Includes study abroad, foundation, bridging and other courses not leading to an Australian award. |
| Source: Department of Immigration and Citizenship, BR0097 Student visa program report 2010-11 to 31 December 2010, p 12. |
In 2009-10, the higher education sector increased its representation of all student visas by 2 percentage points (up to 44% in 2009-10) when compared with 2008-09. By contrast, the VET sector's proportional representation of all visas granted to students had fallen by 6 percentage points (down to 27% in 2009-10).
Table 6.19 shows that on a year-to-year basis, the highest annual growth in student applications granted was recorded in 2006-07 and 2007-08, each year increasing 21% on the previous period. The VET sector increased the most in proportional term, increasing by 56% in 2007-08 and 51% in 2008-09. Between 2004-05 and 2009-10, the average annual growth rate in student applications granted was 9%. The VET sector had the highest average annual growth rate at 23% over the six year period.
6.19 STUDENT APPLICATIONS GRANTED, Student visa subclass - Annual growth and average annual growth rate - 2004-05 to 2009-10 |
|
| GROWTH ON PREVIOUS YEAR | AVERAGE ANNUAL GROWTH RATE |
| 2004-05 | 2005-06 | 2006-07 | 2007-08 | 2008-09 | 2009-10 | 2004-05 to 2009-10 |
| Student visa subclass | % | % | % | % | % | % | % |
|
| 570-ELICOS(a) | 1.8 | 18.7 | 13.6 | 0.6 | 19.4 | -3.3 | 9.4 |
| 571-Schools | -12.7 | -0.4 | 29.2 | 3.7 | -16.8 | -11.4 | -0.3 |
| 572-VET(b) | 2.3 | 18.3 | 46.0 | 56.4 | 51.4 | -30.6 | 23.2 |
| 573-Higher education(c) | 50.3 | 13.6 | 19.1 | 16.4 | 2.7 | -11.1 | 7.5 |
| 574-Postgraduate research(c) | -70.5 | -49.9 | 6.5 | 18.1 | 19.9 | 12.1 | -3.3 |
| 575-Non-award(d) | 26.5 | -0.1 | -0.6 | 17.6 | -8.6 | -4.5 | 0.4 |
| 576-AusAID/Defence | -3.3 | 29.1 | 1.6 | -2.7 | -10.2 | 3.9 | 3.5 |
| Total | 2.4 | 8.8 | 20.6 | 20.8 | 14.7 | -15.4 | 9.0 |
|
| (a) English Language Intensive Courses for Overseas Students. |
| (b) Vocational Education and Training. |
| (c) Due to legislative change, from 1 July 2004, the Masters by Coursework qualification moved from the Postgraduate Research Sector to the Higher Education Sector. |
| (d) Includes study abroad, foundation, bridging and other courses not leading to an Australian award. |
| Source: Department of Immigration and Citizenship, BR0097 Student visa program report 2010-11 to 31 December 2010, p 12. |
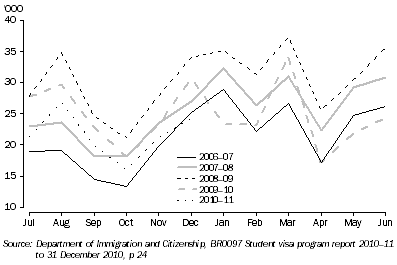
Student applications lodged
Student applications lodged to DIAC to December 2010 indicate that numbers are falling (see figure 6.20) from a peak in 2008-09 (365,800 persons). In the six months ending December 2010, 129,600 applications were lodged, compared with the same six months of 2009 when 152,400 applications for student visas were lodged
(footnote 3) .
6.20 INTERNATIONAL APPLICATIONS FOR STUDENT VISAS, Australia
- Jul 2006 to Dec 2010
Stock of student visa holders
At 30 June 2010, there were 382,700 student visa holders residing in Australia, slightly lower than the stock at 30 June 2009 (386,300 persons) and 83% higher than at 30 June 2006 (209,200 persons).
(footnote 4) Students engaged in the higher education sector at 30 June 2010 contributed 52% of the stock of all student visa holders in Australia followed by students in the VET sector (32%). Citizens of India and China (each representing 21%) comprised the highest proportions of the stock of all student visa holders residing in Australia.
New source of data for projections of NOM from DIAC
On 3 June 2011, the Minister for Immigration and Citizenship, Chris Bowen MP, released a new quarterly report:
The Outlook for Net Overseas Migration: May 2011, as a first step towards a comprehensive annual report on Australia's future immigration levels. This quarterly report will provide forecasts and projections of NOM by flow and major visa component over the next five years. This report noted that:
'recent reforms to temporary and permanent skilled migration as well as changes to student visa settings have had an impact in reducing NOM by restoring the balance between inflows and outflows of temporary migrants including international students. The more recent decline in NOM is due in part to the lower numbers of international student arriving. It is also driven by increased numbers of students departing Australia.'(footnote 5)
This has reduced the student's impact on NOM. Although this is not yet apparent in the final NOM data from the ABS due to the time lags, it is evident in the latest visa grants data from DIAC.
1 DIAC 2010, Media releases, Minister for Immigration and Citizenship, 2010 Chris Bowen MP, 16 December, Review of student visa program.
<back
2 DIAC 2011, BR0097 Student visa program report 2010-11 to 31 December 2010, p 1.
<back
3 DIAC 2011, BR0097 Student visa program report 2010–11 to 31 December 2010, p 24.
<back
4 DIAC 2011, BR0097 Student visa program report 2010–11 to 31 December 2010, p 16.
<back
5 DIAC 2011, The Outlook for Net Overseas Migration: May 2011, p 7.
<back
1 APH 2010, Overseas students: immigration policy changes 1997–May 2010, p various.
<back
2 APH 2010, Overseas students: immigration policy changes 1997–May 2010, p 13.
<back
 Quality Declaration
  Print Page
 Print All