INNOVATION IN AUSTRALIAN BUSINESS
The development, introduction or implementation of new or significantly improved goods, services, processes or methods is generally considered to be innovation. Innovation is often seen as a continuous process. Therefore, it can be difficult to measure and aspects of the process can also be intangible. An international framework, the 'Oslo Manual, Guidelines for Collecting and Interpreting Innovation Data', has been developed jointly by Eurostat and the Organisation for Economic Co-operation and Development (OECD) to aid in measuring the process of innovation. This manual, updated in 2005, forms the basis of concepts used to measure innovation in the 2005-06 BCS.
Readers of this release are advised against making any comparisons between the measures of innovation presented here and those previously released. In moving to the BCS as a survey vehicle for collection of innovation statistics, the ABS has taken the opportunity to collect a more detailed range of innovation indicators. More information about these changes is included Explanatory Notes 31 to 35.
Measures of business innovation
Key indicators of innovation include: measures of business innovation (innovating, innovation-active); types of innovation (goods or services, operational processes, organisational/managerial processes, marketing methods); and status of innovation (introduced or implemented, still in development, abandoned).
Innovating businesses - businesses which introduced or implemented any type of innovation during the reference period.
Innovation-active businesses - businesses which had undertaken any innovative activity during the reference period, including introduction or implementation of any type of innovation and/or businesses with work on the development or introduction either still in progress or abandoned.
Types of innovation
Goods or services - Any good or service or combination of these which is new to a business (or significantly improved). Its characteristics or intended uses differ significantly from those previously produced/offered.
Operational processes - New or significantly improved methods of producing or delivering goods or services of a business (including significant change in techniques, equipment and/or software).
Organisational/managerial processes - New or significantly improved strategies, structures or routines of a business which aim to improve performance.
Marketing methods - New or significantly improved design, packaging or sales methods aimed to increase the appeal of goods or services of a business or to enter new markets.
Status of innovation
Introduced or implemented - the business successfully introduced or implemented an innovation during the reference period (although the innovation does not need to have been commercially successful).
Still in development - the business was in the process of developing, introducing or implementing an innovation during the reference period but work on the innovation was still in progress at the end of the period.
Abandoned - the business abandoned the development and/or introduction of an innovation during the reference period (i.e. work on the innovation ceased without full introduction occurring).
Innovation in Australian Business, by status, by selected business characteristics, 2005-06 |
|  |
| | | Proportion of businesses with innovation which was | | |
| | |
| | |
| | Total number of businesses | introduced or implemented (innovating businesses) | still in
development | abandoned | Proportion of
businesses with any
innovative activity
(innovation-active
businesses) | |
| | '000 | % | % | % | % | |
| |
| Employment size | | | | | | |
| 0-4 persons | 466 | 31.5 | 9.5 | 5.9 | 35.4 | |
| 5-19 persons | 195 | 48.8 | 15.4 | 8.4 | 51.6 | |
| 20-199 persons | 52 | 65.5 | 18.6 | 8.0 | 67.7 | |
| 200 or more persons | ^4 | 74.0 | 28.6 | 9.0 | 76.5 | |
| Industry | | | | | | |
| Mining | 3 | 36.3 | 15.6 | 3.5 | 41.1 | |
| Manufacturing | 57 | 44.6 | 11.6 | 5.6 | 45.7 | |
| Electricity, gas and water supply | 1 | 40.8 | 19.0 | 5.0 | 44.5 | |
| Construction | 116 | 28.5 | 10.0 | 4.0 | 32.6 | |
| Wholesale trade | 47 | 56.9 | 17.3 | 13.7 | 60.3 | |
| Retail trade | 120 | 41.8 | 9.3 | 9.0 | 45.1 | |
| Accommodation, cafes and restaurants | 38 | 32.6 | 7.7 | 7.8 | 38.3 | |
| Transport and storage | 35 | ^40.8 | 7.1 | 1.3 | ^42.3 | |
| Communication services | 8 | 38.8 | 9.6 | 1.3 | 39.0 | |
| Finance and insurance services | 20 | 47.3 | 13.3 | 5.4 | 50.2 | |
| Property and business services | 166 | 37.3 | 14.6 | 7.3 | 41.7 | |
| Health and community services | 52 | 33.0 | 10.2 | 4.8 | 35.8 | |
| Cultural and recreational services | 19 | 42.0 | 15.3 | 7.5 | 45.6 | |
| Personal and other services | 34 | 44.3 | 15.9 | 7.4 | 48.0 | |
| Region | | | | | | |
| Capital cities | 500 | 39.7 | 12.0 | 7.2 | 43.3 | |
| Other areas | 216 | 36.9 | 11.3 | 5.8 | 40.1 | |
| Total | 716 | 38.9 | 11.8 | 6.8 | 42.4 | |
| |
| ^ estimate has a relative standard error of 10% to less than 25% and should be used with caution |
Measures of business innovation
The proportion of businesses which were innovation-active during the year ended 30 June 2006 is 42%. The proportion of innovating businesses was 39%, while 12% of businesses had innovation that was still in development and 7% of businesses abandoned an innovation.
Employment size
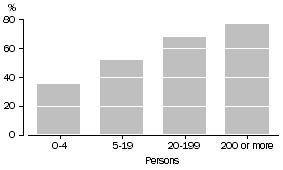
The proportion of businesses that were innovation-active was greater for each successive employment size range, from 35% for businesses with 0-4 persons employed to more than double this proportion for businesses with 200 or more persons employed (76%).
Proportion of innovation-active businesses, by employment size, 2005-06
Industry
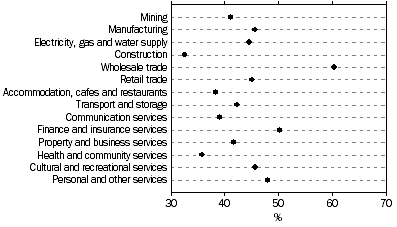
At the industry level, the proportions ranged from 33% for Construction to 60% for Wholesale trade. Over two-thirds of industries recorded an innovation-active rate of 40% or more.
Proportion of innovation-active businesses, by industry, 2005-06
Region
The proportion of innovation-active businesses in Capital cities was 43% compared with 40% for businesses in Other areas.
Status of innovation
Introduced or implemented
The proportion of innovating businesses increased with each successive employment size range, from 32% for businesses with 0-4 persons employed, to 74% for businesses with 200 or more persons employed. The proportions at the industry level ranged from 28% in Construction to 57% in Wholesale trade. Capital cities recorded 40% of businesses as innovating compared with 37% in Other areas.
Still in development
The proportion of businesses which had an innovation still in development at the end of June 2006 also increased with employment size, with the highest proportion (29%) being for businesses with 200 or more persons employed. The industry with the highest proportion was Electricity, gas and water supply (19%) and the highest region was Capital cities, where 12% of businesses reported innovation still in development.
Abandoned
The proportion of businesses that abandoned an innovation was highest for businesses with 200 or more persons employed (9%). The industry with the highest proportion was Wholesale trade (14%) and the highest region was in Capital cities where 7% of businesses reported innovation that was abandoned.
Introduced or implemented innovation(a), by type, by selected business characteristics, 2005-06 |
| |
| | Proportion of businesses which introduced or implemented any new or significantly improved | | |
| |
| | |
| | goods or services | operational processes | organisational/
managerial
processes | marketing methods | Proportion of
innovating
businesses | |
| | % | % | % | % | % | |
| |
| Employment size | | | | | | |
| 0-4 persons | 16.5 | 15.7 | 14.3 | 11.2 | 31.5 | |
| 5-19 persons | 22.8 | 29.0 | 29.6 | 19.0 | 48.8 | |
| 20-199 persons | 30.2 | 35.1 | 42.3 | 24.5 | 65.5 | |
| 200 or more persons | ^43.4 | ^45.9 | ^55.0 | 26.0 | 74.0 | |
| Industry | | | | | | |
| Mining | 11.3 | 17.4 | 23.1 | 10.6 | 36.3 | |
| Manufacturing | 19.3 | 31.5 | 21.5 | 16.3 | 44.6 | |
| Electricity, gas and water supply | 17.9 | 22.8 | 24.1 | 9.5 | 40.8 | |
| Construction | 12.2 | 12.5 | 16.1 | 8.3 | 28.5 | |
| Wholesale trade | 35.1 | 30.5 | 27.1 | 28.4 | 56.9 | |
| Retail trade | 22.7 | 20.1 | 18.2 | 17.0 | 41.8 | |
| Accommodation, cafes and restaurants | 13.1 | 18.8 | 19.5 | 14.0 | 32.6 | |
| Transport and storage | 16.8 | 29.8 | 20.3 | 9.6 | ^40.8 | |
| Communication services | 20.5 | 24.6 | 17.9 | 12.6 | 38.8 | |
| Finance and insurance services | 22.3 | 21.3 | 19.2 | 21.0 | 47.3 | |
| Property and business services | 19.8 | 21.2 | 21.9 | 13.0 | 37.3 | |
| Health and community services | 13.6 | 17.1 | 22.4 | 8.8 | 33.0 | |
| Cultural and recreational services | 20.7 | 22.1 | 25.5 | 16.2 | 42.0 | |
| Personal and other services | 24.0 | 15.6 | 26.1 | 18.8 | 44.3 | |
| Region | | | | | | |
| Capital cities | 20.9 | 20.4 | 21.0 | 15.0 | 39.7 | |
| Other areas | 15.7 | 21.8 | 19.8 | 12.7 | 36.9 | |
| Total | 19.3 | 20.8 | 20.7 | 14.3 | 38.9 | |
| |
| ^ estimate has a relative standard error of 10% to less than 25% and should be used with caution |
| (a) Innovating businesses. |
Types of innovation introduced or implemented
The most frequently reported type of innovation introduced by businesses was new operational processes (21%), closely followed by new organisational/managerial processes (21%), then new goods or services (19%) and new marketing methods (14%).
Employment size
For each type of innovation, the larger the employment size of the business the more likely the business had introduced an innovation of that type. However, the range of proportions reported across employment size categories varied considerably for each type of innovation introduced. The largest difference was 41 percentage points for new organisational/managerial processes, ranging from 14% (0-4 persons employed) to 55% (200 or more persons employed). In contrast, new marketing methods were introduced by 11% of businesses which employed 0-4 persons and 26% of businesses which employed 200 or more persons, a difference of 15 percentage points.
Industry
For three of the four types of innovation (new goods or services, organisational/managerial processes and marketing methods) Wholesale trade was the industry which had the highest proportion of businesses reporting an introduced innovation (35%, 27% and 28% respectively). Manufacturing recorded the highest proportion of businesses which had introduced new operational processes at 32%, followed by Wholesale trade at 30%.
Construction had the lowest proportion of businesses which reported introduction of new operational processes, organisational/managerial processes and marketing methods (12%, 16% and 8%, respectively). Mining had the lowest proportion (11%) of new goods or services introduced, with Construction the second lowest (12%).
Region
Capital cities reported a higher proportion of businesses for all types of innovations introduced except new operational processes.
Innovation still in development, by type, by selected business characteristics, 2005-06 |
| |
| | Proportion of businesses with innovation activity still in development for any new or significantly improved | | |
| |
| | |
| | goods or
services | operational processes | organisational/
managerial
processes | marketing methods | Proportion of
businesses with
any innovation
still in development | |
| | % | % | % | % | % | |
| |
| Employment size | | | | | | |
| 0-4 persons | 5.4 | 3.5 | 2.8 | 4.1 | 9.5 | |
| 5-19 persons | 7.5 | 6.8 | 5.6 | 7.4 | 15.4 | |
| 20-199 persons | 7.2 | 10.6 | 6.7 | 6.6 | 18.6 | |
| 200 or more persons | 12.9 | 18.6 | 10.7 | 4.4 | 28.6 | |
| Industry | | | | | | |
| Mining | 7.1 | 7.0 | 6.1 | 3.5 | 15.6 | |
| Manufacturing | 6.6 | 5.6 | 3.8 | 4.3 | 11.6 | |
| Electricity, gas and water supply | 8.9 | 9.0 | 4.5 | 4.2 | 19.0 | |
| Construction | 7.5 | 4.1 | 3.2 | 3.6 | 10.0 | |
| Wholesale trade | 9.1 | 6.7 | 4.6 | 10.3 | 17.3 | |
| Retail trade | 4.0 | 3.3 | 2.3 | 4.7 | 9.3 | |
| Accommodation, cafes and restaurants | 4.7 | 3.0 | 3.0 | 4.8 | 7.7 | |
| Transport and storage | 2.3 | 4.0 | 2.5 | 2.2 | 7.1 | |
| Communication services | 2.3 | 3.3 | 5.0 | 5.1 | 9.6 | |
| Finance and insurance services | 1.6 | 6.8 | 5.3 | 8.3 | 13.3 | |
| Property and business services | 7.9 | 5.7 | 4.6 | 6.0 | 14.6 | |
| Health and community services | 4.0 | 6.1 | 5.3 | 2.7 | 10.2 | |
| Cultural and recreational services | 5.4 | 7.4 | 5.9 | 6.6 | 15.3 | |
| Personal and other services | 7.9 | 6.6 | 5.6 | 7.5 | 15.9 | |
| Region | | | | | | |
| Capital cities | 6.4 | 5.1 | 3.8 | 5.4 | 12.0 | |
| Other areas | 5.4 | 4.8 | 4.1 | 4.7 | 11.3 | |
| Total | 6.1 | 5.0 | 3.9 | 5.2 | 11.8 | |
| |
Types of innovation still in development
The most frequently reported type of innovation that was still in development as at end of June 2006 was new goods or services (6%), followed by marketing methods (5%), operational processes (5%) and organisational/managerial processes (4%).
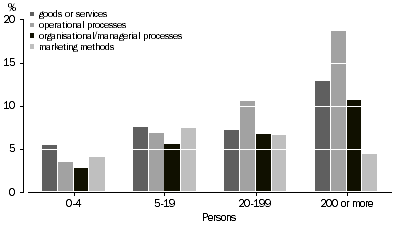
Employment size
Businesses with 200 or more persons had the highest proportion of innovations still in development compared to other employment size ranges for new goods or services (13%), operational processes (19%) and organisational/managerial processes (11%) still in development, whereas businesses with 5-19 persons employed were highest for new marketing methods (7%) still in development.
Proportion of businesses with innovation still in development, by type, by employment size, 2005-06
Industry
At the industry level, the highest proportion of businesses reporting new goods or services still in development was Wholesale trade (9%), while Finance and insurance services reported the lowest (2%). Electricity, gas and water supply had the highest rate of new operational processes still in development and Accommodation, cafes and restaurants had the lowest, at 9% and 3% respectively. Highest rates for new organisational/managerial processes and marketing methods still in development were recorded for Mining (6%) and Wholesale trade (10%), compared to lowest rates of 2% (Retail trade) for new organisational/managerial processes and 2% (Transport and storage) for new marketing methods.
Abandoned innovation, by type, by selected business characteristics, 2005-06 |
| |
| | Proportion of businesses which abandoned the development or introduction of any new or significantly improved | | |
| |
| | |
| | goods or services | operational processes | organisational/
managerial
processes | marketing
methods | Proportion of
businesses with
any abandoned
innovation | |
| | % | % | % | % | % | |
| |
| Employment size | | | | | | |
| 0-4 persons | 2.9 | 2.3 | 1.5 | 2.7 | 5.9 | |
| 5-19 persons | 3.7 | 1.5 | 1.9 | 3.7 | 8.4 | |
| 20-199 persons | 3.5 | 4.3 | 1.5 | 2.2 | 8.0 | |
| 200 or more persons | 5.2 | 2.8 | 2.9 | 1.4 | 9.0 | |
| Industry | | | | | | |
| Mining | 2.8 | 1.5 | 1.6 | 0.2 | 3.5 | |
| Manufacturing | 3.2 | 1.8 | 1.6 | 3.1 | 5.6 | |
| Electricity, gas and water supply | 3.7 | 1.6 | 0.3 | 1.5 | 5.0 | |
| Construction | 2.6 | 0.9 | 0.8 | 1.5 | 4.0 | |
| Wholesale trade | 7.8 | 5.1 | 1.2 | 4.0 | 13.7 | |
| Retail trade | 4.4 | 2.3 | 1.3 | 4.7 | 9.0 | |
| Accommodation, cafes and restaurants | 4.0 | 2.6 | 2.4 | 4.9 | 7.8 | |
| Transport and storage | 0.5 | 0.9 | 0.4 | 0.3 | 1.3 | |
| Communication services | 1.0 | 0.1 | 0.1 | 0.2 | 1.3 | |
| Finance and insurance services | 0.2 | 2.6 | 2.6 | 2.6 | 5.4 | |
| Property and business services | 3.0 | 3.3 | 2.4 | 3.0 | 7.3 | |
| Health and community services | 1.4 | 0.7 | 1.2 | 1.4 | 4.8 | |
| Cultural and recreational services | 2.9 | 2.6 | 1.8 | 4.7 | 7.5 | |
| Personal and other services | 2.3 | 1.5 | 2.4 | 2.4 | 7.4 | |
| Region | | | | | | |
| Capital cities | 3.5 | 2.1 | 1.4 | 3.1 | 7.2 | |
| Other areas | 2.5 | 2.5 | 2.0 | 2.7 | 5.8 | |
| Total | 3.2 | 2.2 | 1.6 | 3.0 | 6.8 | |
| |
Types of innovation abandoned
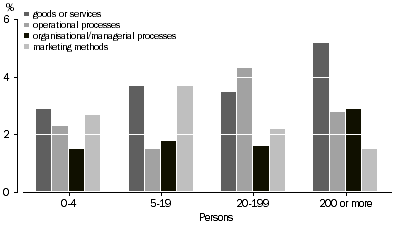
The most prevalent type of abandoned innovation was new goods or services (reported by 3% of businesses), followed by marketing methods (3%), operational processes (2%) and organisational/managerial processes (2%).
Employment size
The highest proportion of businesses with abandoned new goods or services (5%) was reported by businesses with 200 or more persons employed, as was abandoned new organisational/managerial processes (3%). For abandoned new operational processes, businesses which employed 20-199 persons had the highest proportion at 4%, whereas abandoned new marketing methods was highest for businesses which employed 5-19 persons, at 4%.
Proportion of businesses with abandoned innovation, by type, by employment size, 2005-06
Industry
Businesses in Wholesale trade reported the highest rate of abandoned new goods or services (8%) and operational processes (5%). For abandoned new organisational/managerial processes, the highest rate was 3% for Finance and insurance services, while Accommodation, cafes and restaurants recorded the highest rate for abandoned new marketing methods (5%).
 Print Page
 Print All