Recurrent expenditure
In 2011-12 the estimate of expenditure funded by state and territory government on recurrent cultural activities was 79% of total expenditure, which was a decrease from 2010-11 (82%).
Across all state and territory governments, the proportion of recurrent expenditure ranged from 68% of total expenditure by the Australian Capital Territory Government to 89% by the Tasmanian Government.
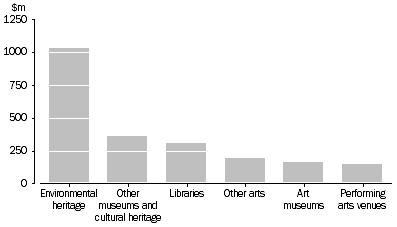
Of all recurrent expenditure, 40% was for the Environmental heritage category. This was followed by Other museums and cultural heritage (14%), Libraries (12%), Other arts (8%) and Art museums (6%).
STATE AND TERRITORY GOVERNMENT RECURRENT CULTURAL EXPENDITURE, By selected categories
- 2011-12

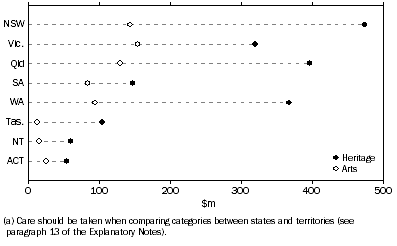
Of all the state and territory governments, the New South Wales Government had the highest estimate for recurrent expenditure on Heritage activities ($474.0m) and the Victorian Government had the highest estimate for recurrent expenditure on Arts activities ($153.8m).
STATE AND TERRITORY GOVERNMENT RECURRENT CULTURAL EXPENDITURE(a), Heritage and Arts
- 2011-12

 Quality Declaration
  Print Page
 Print All