ANALYSIS BY INDUSTRY
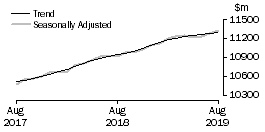
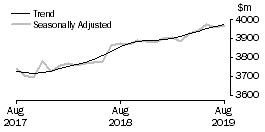
FOOD RETAILING
In current prices, the trend estimate for Food retailing rose 0.1% in August 2019. The seasonally adjusted estimate rose 0.4%. By industry subgroup, the trend estimate rose for Supermarkets and grocery stores (0.2%), and Liquor retailing (0.1%), and fell for Other specialised food retailing (-0.7%). The seasonally adjusted estimate rose for Supermarkets and grocery stores (0.2%), Liquor retailing (1.2%), and Other specialised food retailing (1.5%).
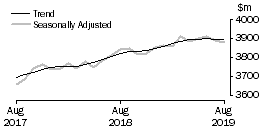
HOUSEHOLD GOODS RETAILING
In current prices, the trend estimate for Household goods retailing rose 0.1% in August 2019. The seasonally adjusted estimate rose 0.3%. By industry subgroup, the trend estimate rose for Electrical and electronic goods retailing (0.3%), was relatively unchanged for Hardware, building and garden supplies retailing (0.0%), and fell for Furniture, floor coverings, houseware and textile goods retailing (-0.2%). The seasonally adjusted estimate rose for Electrical and electronic goods retailing (0.7%), and Furniture, floor coverings, houseware and textile goods retailing (0.3%), and was relatively unchanged for Hardware, building and garden supplies retailing (0.0%).
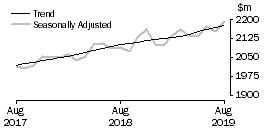
CLOTHING, FOOTWEAR AND PERSONAL ACCESSORY RETAILING
In current prices, the trend estimate for Clothing, footwear and personal accessory retailing rose 0.3% in August 2019. The seasonally adjusted estimate rose 1.8%. By industry subgroup, the trend estimate rose for Footwear and other personal accessory retailing (0.6%), and Clothing retailing (0.1%). The seasonally adjusted estimate rose for Clothing retailing (1.5%), and Footwear and other personal accessory retailing (2.3%).
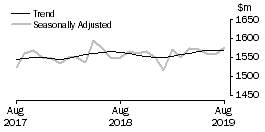
DEPARTMENT STORES
In current prices, the trend estimate for Department stores fell 0.1% in August 2019. The seasonally adjusted estimate rose 1.1%.
OTHER RETAILING
In current prices, the trend estimate for Other retailing rose 0.3% in August 2019. The seasonally adjusted estimate rose 0.3%. By industry subgroup, the trend estimate rose for Pharmaceutical, cosmetic and toiletry goods retailing (0.2%), Other retailing n.e.c (0.2%), and Other recreational goods retailing (0.5%), and was relatively unchanged for Newspaper and book retailing (0.0%). The seasonally adjusted estimate rose for Other retailing n.e.c (0.7%), Other recreational goods retailing (2.9%), and Pharmaceutical, cosmetic and toiletry goods retailing (0.2%), and fell for Newspaper and book retailing (-6.2%).
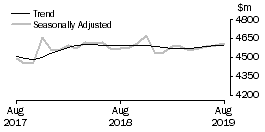
CAFES, RESTAURANTS AND TAKEAWAY FOOD SERVICES
In current prices, the trend estimate for Cafes, restaurants and takeaway food services fell 0.1% in August 2019. The seasonally adjusted estimate fell 0.3%. By industry subgroup, the trend estimate fell for Cafes, restaurants and catering services (-0.2%), and rose for Takeaway food services (0.1%). The seasonally adjusted estimate fell for Takeaway food services (-0.4%), and Cafes, restaurants and catering services (-0.2%).
 Print Page
 Print All