STONE AND ORCHARD FRUIT AND NUTS, Australia, year ended 30 June 2015
Production
Change in production since
Fruit bearing trees
Change in fruit bearing trees since
Yield
Change in yield since
2013-14
2013-14
2013-14
t
%
'000
%
kg/tree
%
Avocados
49 397
12
1 251
5
39.5
7
Cherries
15 547
22
1 775
-6
8.8
31
Mangoes
39 010
-7
1 063
-11
36.7
5
Nectarines
32 756
17
1 535
-3
21.3
21
Olives
50 501
-23
4 507
-7
11.2
-18
Peaches
46 145
9
1 780
-5
25.9
15
Apples
295 196
11
10 178
6
29.0
4
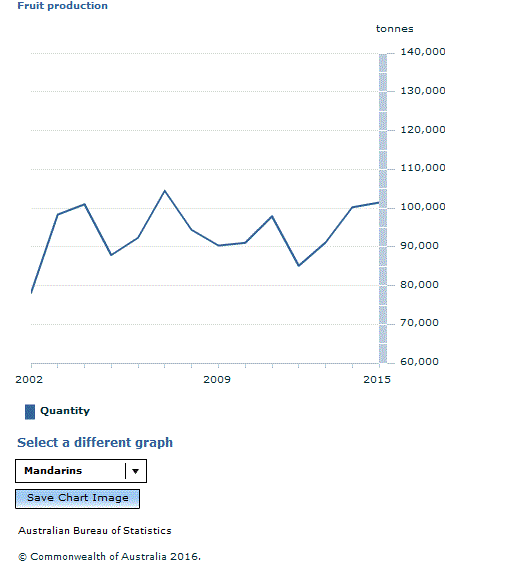
Mandarins
101 437
1
1 907
9
53.2
-7
Oranges
337 636
-4
6 711
2
50.3
-5
Pears (a)
105 243
7
1 621
6
64.9
1
Almonds
63 331
13
6 109
-1
10.4
15
Macadamias
39 783
25
5 273
-8
7.5
35
(a) Includes nashi
OTHER FRUIT, Australia, year ended 30 June 2015
Production
Change in production since
Fruit bearing area
Change in fruit bearing area since
Yield
Change in yield since
2013-14
2013-14
2013-14
t
%
ha
%
t/ha
%
Bananas
252 024
-1
10 936
-10
23.0
9
Pineapples
82 380
-8
2 032
21
40.5
-24
Strawberries
45 604
19
2 240
5
20.4
13
Grapes
1 728 759
12
144 601
4
12.0
6
VEGETABLES, Australia, year ended 30 June 2015
Production
Change in production since
Area
Change in area since
Yield
Change in yield since
2013-14
2013-14
2013-14
t
%
ha
%
t/ha
%
Beans (b)
34 045
15
6 210
4
5.5
11
Capsicums (c)
43 732
-16
1 951
-6
22.4
-10
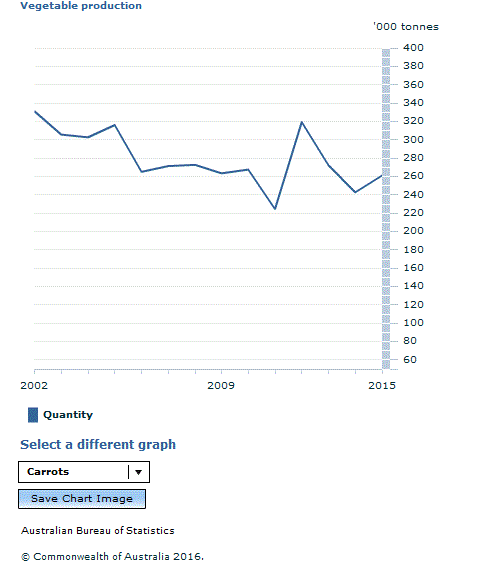
Carrots
261 057
8
4 623
2
56.5
5
Melons (d)
263 234
16
6 505
3
40.5
13
Mushrooms
42 777
-29
153
-29
279.9
1
Onions (e)
314 934
23
5 986
22
52.6
1
Potatoes
1 154 503
-1
29 414
0
39.3
-2
Tomatoes (f)
389 205
19
5 847
14
66.6
5
(b) Includes french and runner
(c) Excludes chillies
(d) Includes rock, bitter and water
(e) Includes brown, red and white onions
(f) Includes processing and fresh market
Increased production was reported nationally across most fruit and nut commodities driven by a rise in grape production (up 12% to 1,7 million tonnes).
Apple production increased by 28,000 tonnes (to 295,000 tonnes) from the previous season, returning to levels not seen since 2010-11. Pear production also rose (up 7% to 105,000 tonnes).
Olives provided an offset to these rises, reporting a 23% (15,000 tonnes) decrease in production and orange production was also down 4% (12,000 tonnes), primarily due to loss of trees in South Australia (where there was a 16% reduction in trees of bearing age).
Vegetable production also increased across a number of commodities in 2014-15.
The production of processing tomatoes increased by almost 50% (to 234,000 tonnes) between 2013-14 and 2014-15 following the recent expansion of processing and canning plants in Victoria.
Onion production increased 23% nationally driven by a 72% rise in South Australia following increases in area planted (up by 57%) and improved yields (up from 57.2 t/ha to 62.8 t/ha).
Document Selection
These documents will be presented in a new window.
 Quality Declaration
  Print Page
 Print All