SUMMARY OF FINDINGS
INTRODUCTION
This publication presents the results of a study of the effects of government benefits and taxes on the distribution of income among private households in Australia in 2003-04.
Benefits and taxes included in the study were restricted to those that are relatable to particular types of households and household expenditure. Household income is increased directly by the Australian government through social assistance benefits in the form of regular cash payments, such as the age pension and family tax benefit, and indirectly by government expenditures such as those on health and education. On the other hand, household income is reduced by taxes on personal income (direct taxes) and by taxes on production (indirect taxes) passed on in the prices households pay for goods and services.
The study excludes government taxes and expenditure that do not relate directly to particular types of households or household expenditure, such as government revenue from corporate taxes and spending on defence, public order and safety, transport and communications.
The most restricted concept of income used in the study is referred to as private income, while the most extensive is final income. Private income is all regular cash payments received excluding social assistance benefits in cash, i.e. wages and salaries, profit/loss from own unincorporated business, investment income and private cash transfers. Adding social assistance benefits in cash (direct Australian government benefits) to private income gives gross income. Disposable income is derived by subtracting taxes on personal income from gross income.
The value of government social transfers in kind for education, health, housing and social security and welfare (indirect benefits) is added to disposable income to get disposable income plus social transfers in kind. Final income is equal to disposable income plus social transfers in kind less taxes on production.
Equivalised household income is derived after applying an equivalence scale to income thereby taking into account households of different sizes and composition. When household income is adjusted using an equivalence scale, the equivalised income can be viewed as an indicator of the economic resources available to a standardised household. In this study, an equivalence scale has been applied to the estimates of household private, disposable and final income.
The methodology used in this study is similar to that used in other studies in Australia and overseas. However, there are other approaches that could have been taken which might have produced different results. Details of the study methodology are given in the Explanatory Notes. The results are dependent on the assumptions that are inherent in the methodology.
GOVERNMENT BENEFITS AND TAXES ALLOCATED
Of the total Commonwealth, state and local government taxation revenue in 2003-04, the study allocates taxes of $145,623 million out of $245,856 million or 59% of total government revenue (net of the subsidies). Of total government expenditure of $295,180 million, the study allocates benefits of $151,075 million or 51% of total government expenditure.
The unallocated amounts mainly reflect taxation and government expenditure that are not conceptually relatable to individual households, but they also reflect the lack of suitable indicators on which to allocate some taxation revenue, such as capital gains tax, and some benefits. In comparison, the 1998-99 study allocated 53% of government revenue and 50% of government expenditure.
The most significant factor in the increased allocation of government revenue between the 1998-99 and 2003-04 studies was the adoption of a substantially improved methodology for allocating taxes on production. For the 1998-99 study, the previous methodology allocated 42% of taxes on production to individual households. Applying the new method to the 1998-99 Household Expenditure Survey (HES) data resulted in 65% of taxes on production being allocated to individual households.
The introduction of the Goods and Services Tax (GST) since the 1998-99 study, both widened the base for taxes on production and resulted in taxes on production being more directly attributable to reported household expenditures than was possible with the previous indirect taxation arrangements that it replaced. This change in taxation arrangements, coupled with the new methodology for allocating the remaining indirect taxes to individual households, was expected to result in an even higher proportion of all production taxes being allocated to individual households in 2003-04 than was achieved in the recompiled estimates for 1998-99.
However, in the 2003-04 HES there was a significant increase in the apparent underreporting by households of expenditures on highly taxed products, such as gambling and tobacco. It is estimated that the under-allocation of tax due to underreported expenditures increased from about $5 billion in 1998-99 to $15 billion in 2003-04. As a result only 60% of taxes on production were allocated to individual households in 2003-04.
More benefits than taxes were allocated in the current study so that on average, benefits exceed taxes. This outcome is not significant in itself as there is not a direct correspondence between the level of government benefits provided to any sector and the means used to finance those benefits.
DIFFERENCES BETWEEN HOUSEHOLDS
The system of government benefits and taxes in Australia has been designed to assist those in the community who are most in need of financial support. The results of this study give an indication of the extent of the redistributive impact between different groups in the population. The following sections summarise the impact on population groups defined in terms of life cycle stages and in terms of high and low income groups.
The allocation of benefits and taxes differs between households, reflecting that characteristics such as household composition, life cycle stages, household size and income have an impact on these allocations.
LIFE CYCLE STAGES
A life cycle includes childhood, early adulthood and the forming and maturing of families. The life cycle stages used in this study provide a simplified view of life cycle possibilities as illustrated in tables 21 and 22. Some household types such as one parent with dependent children and lone persons aged 35-65 years are not included in this sequential analysis.
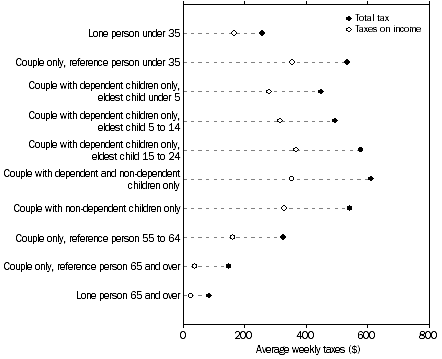
The following two graphs look at total taxes (taxes on income and taxes on production) paid and total benefits (social assistance benefits in cash and social transfers in kind) received on average by these life cycle groups.
1 Taxes, by Selected life cycle group
2 Government Benefits, by Selected life cycle group
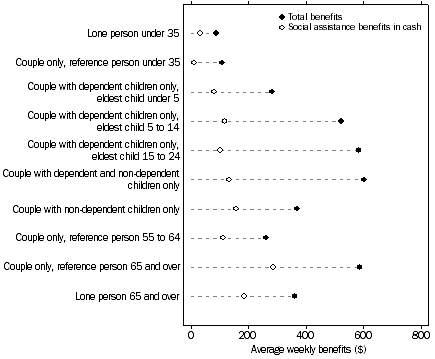
In the first two stages of the life cycle, which consist of young lone person and young couple only households, social assistance benefits in cash tend to be low. This relates to their youth, the absence of children (and therefore family tax benefit and parenting payment) and the high employment levels in these households. Social transfers in kind also tend to be low in these early life cycle stages because the household size is small, the members do not usually receive school benefits and, due to their age, are less likely to use health services. Taxes on income, which increase progressively with the level of income, are lower for lone persons than for couple only households where, on average, more than one person is earning income and paying taxes. Similarly, taxes on production are lower for lone person households than for couple only households because household expenditure is relatively low.
Couples with dependent children generally receive higher levels of social assistance benefits in cash and social transfers in kind than young couple only and young lone person households. Social assistance benefits are higher because the households tend to be eligible for family tax benefit, parenting payment and other benefits such as student allowances. Social transfers in kind are also higher. These households receive greater education and health benefits due to the increase in household size and also greater social security and welfare benefits. Taxes on income for couples with dependent children, are higher than young lone person households, with household income increasing as more household members participate in the labour force. Taxes on production also increase as households spend more of the higher income.
Households including couple with non-dependent children only, receive a similar level of social assistance benefits in cash to couple households with dependent children. However, for these households age and disability support pensions become the most significant sources of these benefits. Social transfers in kind are lower because fewer household members use education services. Levels of income and expenditure are both high, resulting in higher taxes on income and taxes on production.
Once the children leave (couple only with reference person 55 to 64 group), the households are smaller and contain fewer members who are employed. The incomes and expenditures of these households tend to be lower so they pay less in taxes.
In the last two stages, i.e. couple only reference person 65 and over and lone person 65 and over, households receive the highest levels of social assistance benefits in cash, consisting mainly of the age and Veterans' Affairs pensions. Social transfers in kind are high due to greater use of health services. Taxes on income are very low because income is low and taxes on production are low because spending is low.
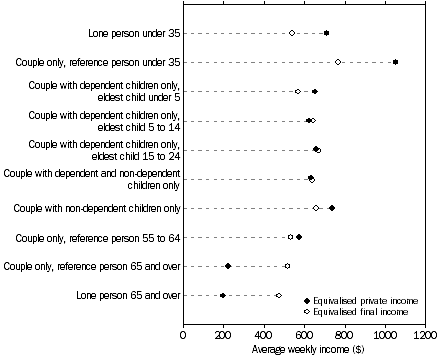
The differences between benefits and taxes allocated to the selected life cycle stages is partly a consequence of household size and composition. Equivalising household income takes into account the differing size and composition of households. Comparing equivalised private income and equivalised final income for these life cycle stages provides a better indication of the effect of government benefits and taxes on the relative economic well being of these households.
Equivalised private income is higher in the early stages of the life cycle with young couple only households having the highest average equivalised private income. It remains relatively stable through the stages of family formation and with dependent and non-dependent children at home. In the later stages of the life cycle it declines with the categories for people aged 65 and over having the lowest average equivalised private income. The average equivalised private income of the highest income group (young couple only households) is more than 5 times that of the lowest income group (lone person aged 65 and over).
The differences between the various life cycle groups is much less marked when looking at equivalised final income. As for equivalised private income, equivalised final income is highest for young couples and lowest for lone persons aged 65 and over. However, the equivalised final income for young couples is only 62% higher than the equivalised final income of lone persons aged 65 and over.
3 Equivalised private and equivalised final income, by Selected life cycle group
OTHER HOUSEHOLD GROUPS
About one-third of Australian households are not covered by the life cycle groups in graphs 1 to 3. The household groups which are not included in the life cycle analysis are: one parent with dependent children (6.6%); lone persons aged 35 to 64 (11.9%); couple only, reference person aged 35 to 54 (5.6%); group households (3%); and all other households (6.6%).
One parent with dependent children
One parent with dependent children households are a population group of particular interest. This group has higher net benefits (benefits less taxes) than any of the life cycle groups considered above. Households in this group receive very high levels of social assistance benefits in cash, consisting mainly of family tax benefit and parenting payment. The average value of social assistance benefits in cash for this group was $293 per week compared to $136 per week for all households. Social transfers in kind are also relatively high because of high use of education services (average value of $383 per week compared to average value of $238 per week for all households).
Taxes on income and taxes on production are both low, since both income and expenditure are low. Taxes on income for this group averaged $95 per week as compared to $213 per week for all households and taxes on production averaged $108 per week compared to $147 per week for all households.
The average weekly equivalised private income of this group was just 46% of the average weekly equivalised private income of all households. However due to higher net benefits, the average equivalised final income of this group was a much higher proportion of average equivalised final income of all households (93%).
Lone persons aged 35 to 64
Within this group, the characteristics of the component age subgroups are quite different (see tables 33 and 34 for details). For the younger subgroups (aged 35 to 44, and 45 to 54) taxes outweigh benefits. Lone persons aged 35 to 44 pay the highest taxes of all lone person households, and receive low benefits, resulting in an average net tax payment of $194 per week. The average equivalised private income of these households is 26% greater than the average equivalised private income of all households while their equivalised final income is 9% lower than that of all households. Lone persons aged 45 to 54 pay net taxes of $133 per week. Their average equivalised private income is 10% greater than the average for all households and their equivalised final income is 14% lower than that of all households.
For the older subgroup (aged 55 to 64), average total benefits received ($208) was higher than average total taxes paid ($175). Their average equivalised private income is two thirds of the average for all households and their equivalised final income is 71% of that of all households.
Couple only, reference person aged 35 to 54
Both subgroups within this group (aged 35 to 44, and 45 to 54) pay substantial net weekly taxes compared to all couple only households (see tables 31 and 32 for details). Overall their equivalised private income is 57% above the average for all households and their equivalised final income is 15% above the average.
HIGH AND LOW INCOME GROUPS
Low income households receive more social benefits in cash and social transfers in kind and pay less taxes than high income households. The effects of different benefits and taxes vary with the level of household income. Social assistance benefits in cash and social transfers in kind increase with household size and decrease as levels of household income rise. The net effect of benefits and taxes is to increase the average income of households in the lower income groups, and decrease the average income of households in the higher income groups.
The redistribution of income from high to low income households can be seen more clearly in an analysis of equivalised private income quintile groups (graph 4). Equivalised private income quintile groups are formed by ranking households based on the level of their private income, after adjusting for the size and composition of the household. If no adjustment is made for size and composition, larger households tend to appear in the higher quintile groups as no account is taken of the need for their income to support a larger number of people.
4 Equivalised private and equivalised final income, by Equivalised private income quintile
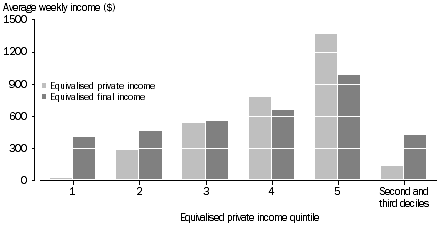
The net effect of benefits and taxes, as shown in this study, was to increase the average income of households in the three lower quintiles and decrease the average income of households in the two higher quintiles. In the lowest quintile, average equivalised private income was $26 per week and average equivalised final income was $403 per week. In the highest quintile, the average equivalised private income was $1,366 per week and average equivalised final income was $983 per week.
The income of households in the second and third deciles has also been included in the graph. This group is often used to represent low income households since the income of many households in the lowest decile may not accurately reflect the level of their economic wellbeing (see paragraphs 22 and 23 of the Explanatory Notes). The average equivalised private income of households in the second and third decile was $132 per week, whereas their average equivalised final income was $427 per week.
Within the lowest equivalised private income quintile, the share of income received by households increased from 0.9% using the equivalised private income measure to 13.2% using the equivalised final income measure. For households in the highest quintile, the income share decreased from 45.7% for equivalised private income to 32.1% for equivalised final income. The share of the income received by households in the second and third decile increased from 4.4% for equivalised private income to 13.9% for equivalised final income.
5 Distribution of household income, benefits and taxes, by Equivalised private income quintile |
|  |
 |  | Equivalised private income quintile |  |  |  |
 |  | Lowest quintile | Second quintile | Third quintile | Fourth quintile | Highest quintile | All households(a) | Second and third deciles |  |
 |  | % | % | % | % | % | % | % |  |
|  |
| Private income | 0.8 | 8.9 | 17.0 | 25.7 | 47.6 | 100.0 | 4.3 |  |
| Benefits |  |  |  |  |  |  |  |  |
 | Social assistance benefits in cash | 60.8 | 23.7 | 9.9 | 3.9 | 1.7 | 100.0 | 44.5 |  |
 | Social transfers in kind | 29.8 | 22.5 | 18.7 | 15.8 | 13.2 | 100.0 | 26.6 |  |
 | Total | 41.1 | 23.0 | 15.5 | 11.5 | 9.0 | 100.0 | 33.1 |  |
| Taxes |  |  |  |  |  |  |  |  |
 | Taxes on income | 0.3 | 4.6 | 13.3 | 23.6 | 58.2 | 100.0 | 1.3 |  |
 | Taxes on production | 13.4 | 15.2 | 18.5 | 22.9 | 30.0 | 100.0 | 14.7 |  |
 | Total | 5.6 | 9.0 | 15.4 | 23.3 | 46.7 | 100.0 | 6.8 |  |
| Final income | 14.0 | 14.2 | 17.0 | 21.2 | 33.5 | 100.0 | 14.1 |  |
| Equivalised private income | 0.9 | 9.6 | 17.9 | 25.9 | 45.7 | 100.0 | 4.4 |  |
| Equivalised final income | 13.2 | 15.1 | 18.1 | 21.6 | 32.1 | 100.0 | 13.9 |  |
|  |
| (a) Includes households with nil or negative total income. |
Both social assistance benefits in cash and social transfers in kind decreased as levels of household income rose. The lowest quintile received 60.8% of social benefits in cash and 29.8% of social transfers in kind whereas the highest quintile received 1.7% of social assistance benefits in cash and 13.2% of social transfers in kind. Households in the second and third deciles received 44.5% of social assistance benefits in cash and 26.6% of total social transfers in kind.
The payment of taxes on income and, to a lesser extent taxes on production, increase with income. Households in the lowest quintile paid 0.3% of total taxes on income while households in the highest quintile paid 58.2%. For taxes on production, households in the lowest quintile paid 13.4% while households in the highest quintile paid 30%. Households in the second and third deciles paid 1.3% of total taxes on income and 14.7% of total taxes on production.
STATES AND TERRITORIES
The allocation of government benefits and taxes varied across states and territories.
Estimates of social transfers in kind by state and territories may not be entirely accurate, since for some components the allocation does not take into account the varying expenditure by state and territory governments. In addition, there may be some inconsistencies in the classification of government expenditure by state governments in the source data, which could impact on comparability.
Households in the Australian Capital Territory (ACT) received the lowest social assistance benefits in cash and paid the highest taxes on income, whereas households in Tasmania received the highest social assistance benefits in cash and paid the lowest taxes on income.
Social transfers in kind varied with Northern Territory (NT) households receiving the highest average total benefits. Households in the ACT received the highest average education benefits, households in the NT received the highest average health benefits, whereas social security and welfare benefits were highest on average for households in Tasmania.
Taxes on production paid by households were highest in NT and the ACT. NT households paid the highest taxes on production on alcoholic beverages and tobacco products. Households in the ACT paid the highest taxes on production on motor vehicle fuel, meals out and fast food, and clothing and footwear. Households in New South Wales (NSW) paid the highest taxes on ownership of dwellings.
6 Equivalised income levels, States and territories - All households
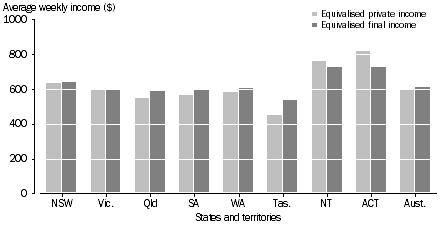
Average income also varies between states and territories. Average income was highest in the ACT and NT. Average equivalised private income in the ACT is 37% higher than the average for Australia. Average equivalised final income, while still significantly higher than the Australian average, is only 18% higher, reflecting the net taxes paid by ACT households. Similarly in NT, equivalised private income is 28% higher than the Australian average and equivalised final income is 18% higher than the Australian average. In Tasmania, which has the lowest average income, equivalised private income is 24% below the Australian average and equivalised final income is 12% below the average, reflecting the net benefits received by Tasmanian households.
 Print Page
 Print All