STAGE OF PRODUCTION COMMENTARY
STAGE OF PRODUCTION (SOP) OVERVIEW
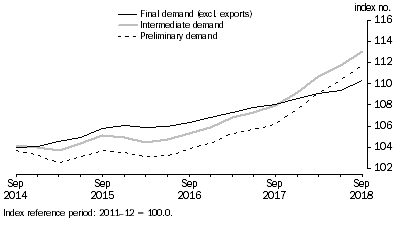
In the September quarter 2018, the Final demand index rose 0.8%, the Intermediate demand index rose 1.2% and the Preliminary demand index rose 1.3%. Through the year to the September quarter 2018, the Final demand index rose 2.1%, the Intermediate demand index rose 4.7% and the Preliminary demand index rose 5.2%.
Final Demand
The rise of 0.8% in the Final demand index in the September quarter 2018 reflected a rise of 0.7% in the prices of domestically produced products and a rise of 1.6% in the prices of imported products.
The domestic component recorded rises in the prices for Heavy and civil engineering construction (+1.0%), Building construction (+0.4%) and Accommodation (+5.6%). There were no offsetting falls recorded this quarter.
The imports component recorded rises in the prices for Computer and electronic equipment manufacturing (+3.2%), Other transport equipment manufacturing (+3.9%) and Specialised machinery and equipment manufacturing (+2.4%). Partly offsetting these rises were falls in the prices for Cleaning compound and toiletry preparation manufacturing (-4.4%), Sugar and confectionery manufacturing (-9.0%) and Other food product manufacturing (-3.7%).
Intermediate Demand
The rise of 1.2% in the Intermediate demand index in the September quarter 2018 reflected a rise of 0.9% in the prices of domestically produced products and a rise of 2.3% in the prices of imported products.
The domestic component recorded rises in the prices for Sheep, beef cattle and grain farming; and dairy cattle farming (+8.9%), Electricity supply; gas supply; and water supply, sewerage and drainage services (+1.8%) and Architectural, engineering and technical services (+2.0%). Partly offsetting these rises were falls in the price for Other fabricated metal product manufacturing (-2.3%), Basic non-ferrous metal manufacturing (-2.0%), and Bakery product manufacturing (-0.7%).
The imports component recorded rises in the prices for Textile, leather, clothing and footwear manufacturing (+1.7%), Petroleum refining and petroleum fuel manufacturing (+6.9%) and Oil and gas extraction (+5.6%). Partly offsetting these rises were falls in the prices for Computer and electronic equipment manufacturing (+1.1%), Sugar and confectionery manufacturing (-9.0%) and Pump, compressor, heating and ventilation equipment manufacturing (-2.7%).
Preliminary Demand
The rise of 1.3% in the Preliminary demand index in the September quarter 2018 reflected a rise of 1.1% in the prices of domestically produced products and a rise of 2.5% in the prices of imported products.
The domestic component recorded rises in the prices for Sheep, beef cattle and grain farming; and dairy cattle farming (+8.6%), Electricity supply; gas supply; and water supply, sewerage and drainage services (+1.8%) and Architectural, engineering and technical services (+2.0%). Partly offsetting these rises were falls in Basic non-ferrous metal manufacturing (-2.9%), Other fabricated metal product manufacturing (-2.9%) and Newspaper, periodical, book and directory publishing (-1.4%).
The imports component recorded rises in the prices for Textile, leather, clothing and footwear manufacturing (+1.8%), Petroleum refining and petroleum fuel manufacturing (+6.7%) and Oil and gas extraction (+5.7%). Partly offsetting these rises were falls in the prices for Basic non-ferrous metal manufacturing (-1.5%), Basic non-ferrous metal product manufacturing (-1.3%) and Sugar and confectionery manufacturing (-9.0%).
Comparison of SOP indexes

 Print Page
 Print All
 Quality Declaration