ONLINE COLLECTION IN THE LABOUR FORCE SURVEY
INTRODUCTION
Households selected in the ABS's Labour Force Survey (LFS) traditionally responded through a telephone or face-to-face interview, but from December 2012 the option of responding through online collection was introduced to incoming rotation groups. This provided respondents with greater choice and ensured that data collection remained cost-effective. Since April 2014, all private dwellings have been provided the option of using the online collection.
To afford additional attention to the quality assurance of April estimates each year, this annual update will be prepared on online collection rates up to March (in this case March 2018).
BACKGROUND
From December 2012 to April 2013, the ABS conducted a trial of online data collection. During this time, households in a single rotation group (i.e. one-eighth of the survey sample) were offered the option of self completing their LFS questionnaire online instead of via a telephone or face-to-face interview.
From May 2013, the ABS expanded the offer of online collection to 50% of each incoming rotation group. From September 2013, online collection has been offered to 100% of households in each incoming rotation group, and by April 2014 100% of LFS households were offered online collection. Interviewer collection (both telephone and face-to-face) continues to be available for households.
The ABS used the initial trial of offering online data collection to a single rotation group and the progressive introduction of the offer to other rotation groups, to measure the impact on the Labour Force series of the move to online data collection. Statistical analysis during this period concluded that there was no evidence of any reporting bias due to the introduction of online collection. Ongoing monitoring and analysis of online responses, has not identified a significant impact from the move to online self completion data collection.
CURRENT COLLECTION PROCEDURES
Households selected in the LFS are sent a letter and brochure informing them that they have been selected to participate in the survey. Since February 2014, survey respondents have been asked to use the unique user name and password provided in the letter to register an email address and other contact details for the household, or to contact the ABS if they are unable to participate in the survey online. A notification is then sent to respondents who have registered their contact details electronically to advise that the survey questionnaire is available for completion online within a specified one week period.
Respondents who are unable to participate in the survey online, along with respondents who register contact details for the household electronically but do not complete the survey questionnaire online within the specified one week period, are subsequently contacted by an ABS interviewer to complete the survey questionnaire either via telephone or face-to-face.
ONLINE COLLECTION TAKE UP
Online collection take up rates have remained consistent since March 2015 (as can be seen in Graph 1). The highest take up rate during the period was 24.5% in September 2017 and the lowest take up rate was 18.0% in August 2015. In the year ending March 2018, the highest take up rate was 24.5% in September 2017 and the lowest take up rate was 20.1% in August 2017.
Graph 1 - Monthly Online collection take up rate

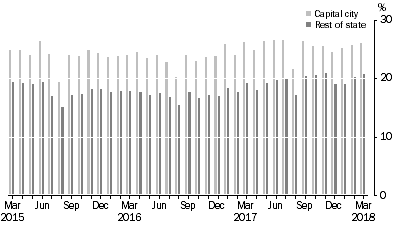
Graph 2 shows that capital city respondents continue to show a stronger preference for online response compared with respondents in the rest of the state.
Graph 2 - Online collection take up rates, by Capital city/ Rest of State

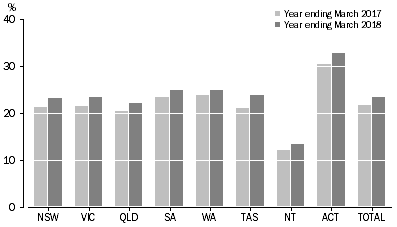
Graph 3 shows there was also a higher take up of online collection in some states and territories than in others. In the year ending March 2017, Australian Capital Territory average take up rates were the highest in Australia (30.6 per cent), while take up was lowest in the Northern Territory (12.1 per cent). In the year ending March 2018, Australian Capital Territory average take up rates remained the highest in Australia and had increased by 2.1 percentage points (to 32.7 per cent), while take up in the Northern Territory also remained the lowest, despite increasing by 1.4 percentage points (to 13.5 per cent).
Graph 3 - Average online collection take up rate

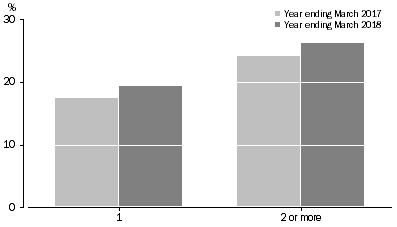
Take up rates by household size show that households with 2 people or more have a stronger preference for online collection, compared with single person households. Take up rates by household size have been relatively consistent in the past two years (as can be seen in Graph 4).
Graph 4 - Household size and average online collection rate

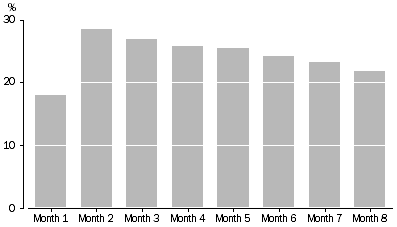
Between April 2017 and March 2018, online collection take up was highest for respondents in their second month in survey, and gradually reduced over the following months (as can be seen in Graph 5). This was seen across all groups (or "panels") who completed their 8 months in the survey between April 2017 and March 2018.
Graph 5 - Average electronic collection take up rates by time in survey

Analysis of the characteristics of respondents who choose to respond through online collection (compared with respondents who favour telephone or face-to-face interviews), continued to show that:
- They were more likely to be female,
- They had a relatively higher participation rate,
- They were more likely to be employed, and
- Were more likely to work in higher skilled occupations (especially professionals).
NEXT UPDATE
The next LFS online collection update will be released with the April 2019 issue, in May 2019.
 Print Page
 Print All
 Quality Declaration