This document was added or updated on 06/11/2020.
ANALYSIS
TREND ESTIMATES
In trend terms the total number of jobs in Australia increased by 108,069 (or 0.8%), made up of 5,234 job vacancies and 102,835 filled jobs.
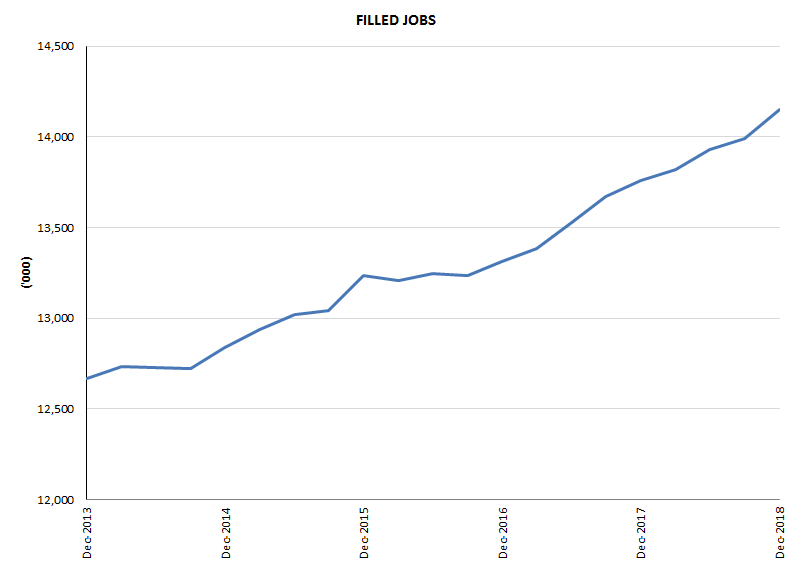
Filled jobs in Australia grew by 0.7% in the December quarter 2018, following a 0.7% rise in the September quarter 2018. Filled jobs grew 2.8% through the year in trend terms.
The number of main jobs grew by 70,982 (an increase of 0.5%) while secondary jobs grew by 31,853 (an increase of 3.3%) in the December quarter 2018.
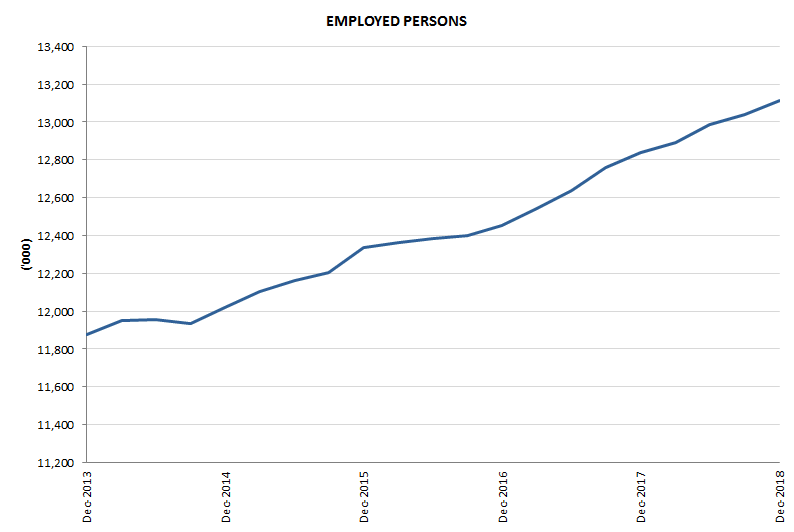
The total number of employed persons increased by 0.5% to 13.1 million in the December quarter 2018.
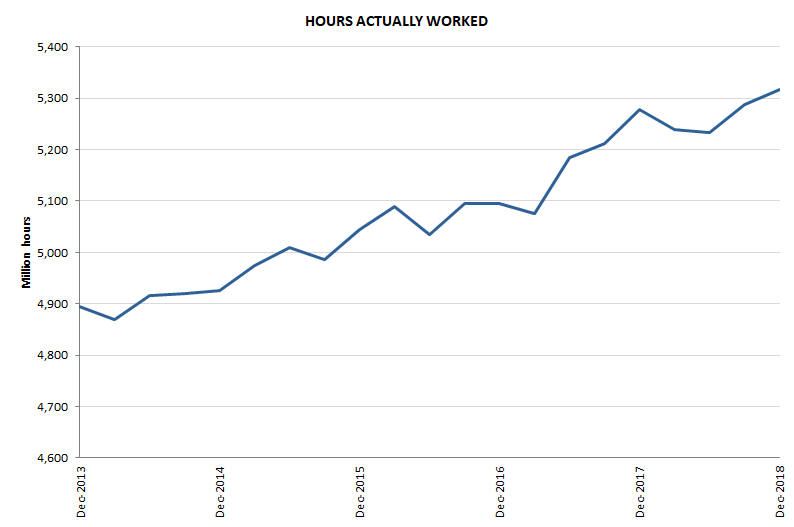
The total number of hours actually worked increased by 0.6% to 5.3 billion hours, and the total labour income increased by 1.1% to $248,645 million.
SEASONALLY ADJUSTED ESTIMATES
Jobs
Filled jobs in Australia grew by 1.1% in the December quarter 2018, following a 0.4% rise in the September quarter 2018. Filled jobs grew 2.8% through the year in seasonally adjusted terms.
The total number of jobs in Australia increased by 162,779 (or 1.1%), made up of 4,874 job vacancies and 157,905 filled jobs.
The number of main jobs grew by 98,882 (an increase of 0.8%), while secondary jobs grew by 59,023 (an increase of 6.1%) in the December quarter 2018.
Persons
The total number of employed persons increased by 0.5% to 13.1 million in the December quarter 2018.
There were 661 thousand unemployed persons in the December quarter 2018, a decrease of 9 thousand persons from September quarter 2018.
There were 1,119 thousand underemployed persons in the December quarter 2018, an increase of 43 thousand persons from September quarter 2018.
Volumes
The total number of hours actually worked increased by 0.6% to 5.3 billion hours; and the total number of hours paid increased 0.4% to 5.7 billion hours.
Payments
Total labour income increased by 0.9% to $248,348 million.
Total compensation of employees increased by 1.0% to $226,071 million, and labour income from self-employment increased by 0.4% to $22,277 million.
Over the same period, total labour costs increased by $2,385 million (0.9%) to $263,612 million.
Ratios
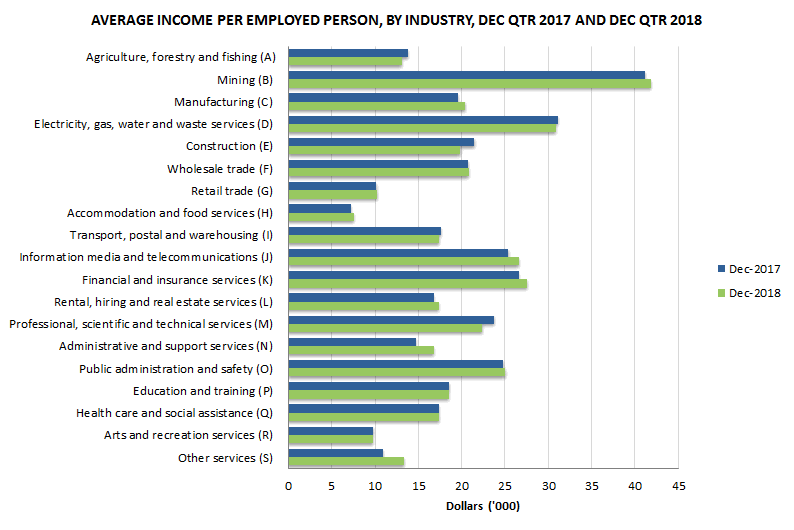
Average income per person increased by 0.4% to $18,940 in the December quarter 2018.
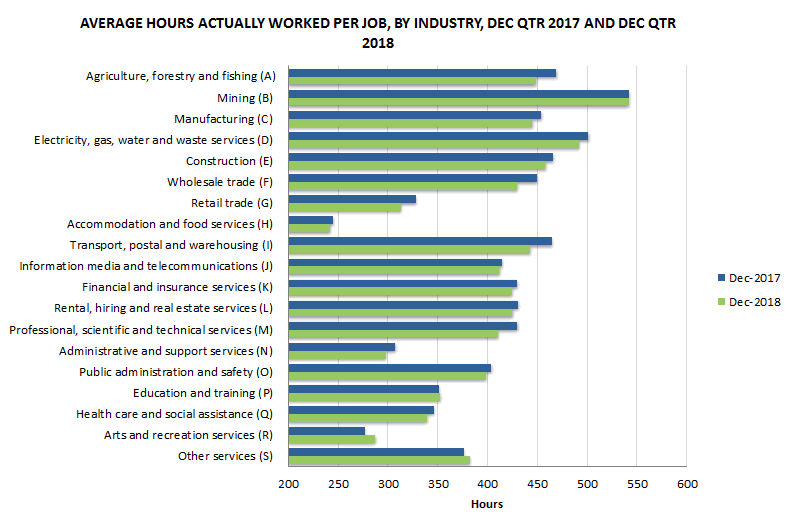
Average hours worked per job decreased by 0.6% to 376 hours.
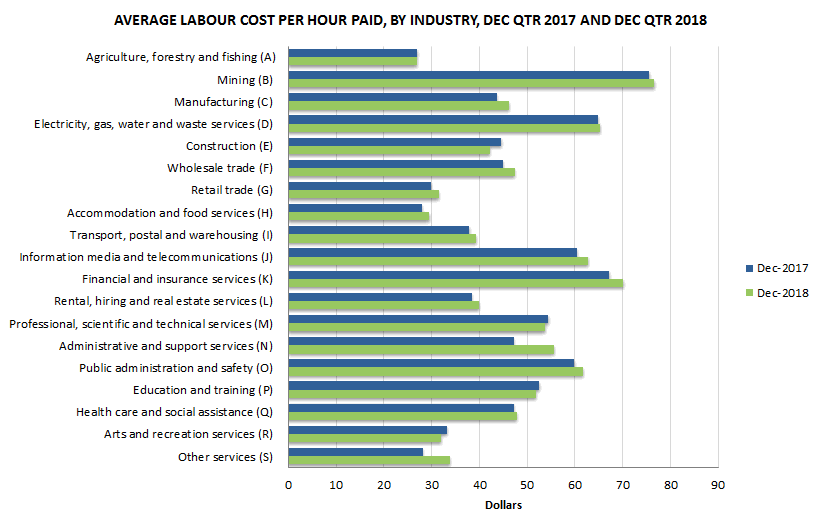
Average labour cost per hour paid remained the same at $46.
Average hours worked per job is the hours actually worked divided by all filled jobs.
 Quality Declaration
  Print Page
 Print All