SPOTLIGHT: HEALTH CARE AND SOCIAL ASSISTANCE INDUSTRY
The Health care and social assistance industry was Australia’s largest employer in 2016-17, with around 1.6 million filled jobs. Its share of total filled jobs in the Australian labour market increased from around 10.8 per cent in 2010-11 to around 12.4 per cent in 2016-17.
In addition to being the largest employer, the Health care and social assistance industry was also the biggest contributor to Australia’s job growth over the period, accounting for nearly one third of total job growth over the past six years, or 336,000 of the 1,063,000 extra jobs in Australia.
In addition to providing information for the Health care and social assistance industry, the Labour Account also now provides useful insights into changes for the four subdivisions within it: Hospitals, Medical and other health care services, Residential care services, and Social assistance services. From this it is possible to see the relative contribution of the different parts of the total labour market over time.
Since 2010-11, the subdivision with the greatest number of jobs has been Hospitals. In 2016-17, there were around 615,000 filled jobs, which was around 37 per cent of jobs in the industry.
The fastest growing subdivision between 2010-11 and 2016-17 was Social assistance services, which increased by 56.6 per cent, from 257,900 jobs to 403,700 jobs. Much of this growth was seen in the most recent year, with jobs increasing by 28.4 per cent, from 314,400 jobs in 2015-16 to 403,700 jobs in 2016-17.
Graph 1: Filled jobs
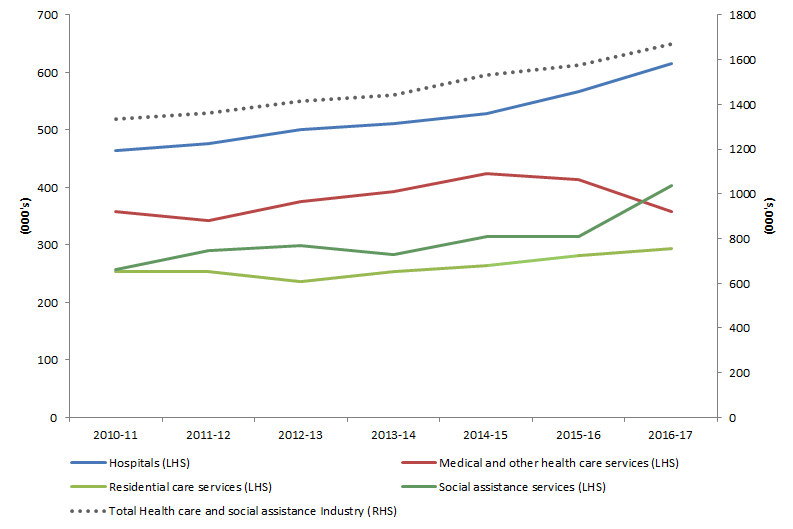
Source: Labour Account Australia, Quarterly Experimental Estimates (cat: 6150.0.55.003)
‘Secondary jobs’ refers to jobs worked by people with multiple jobs at the same time, and the job that they worked fewer hours in. In 2016-17, secondary jobs accounted for 5.0 per cent of all filled jobs in the Health care and social assistance industry. These secondary jobs represented around 9.8 per cent of all secondary jobs in Australia, second only to the Administrative and support services industry (18.9% of all secondary jobs).
Interestingly, the share of filled jobs in Health care and social assistance that were worked as secondary jobs decreased between 2010-11 and 2016-17, from 6.3 per cent to 5.0 per cent, suggesting a shift towards primary jobs. This was most pronounced for jobs in Hospitals, where the rate decreased from 6.1 per cent in 2013-14, down to 3.1 per cent in 2016-17.
Graph 2: Secondary jobs as a share of filled jobs
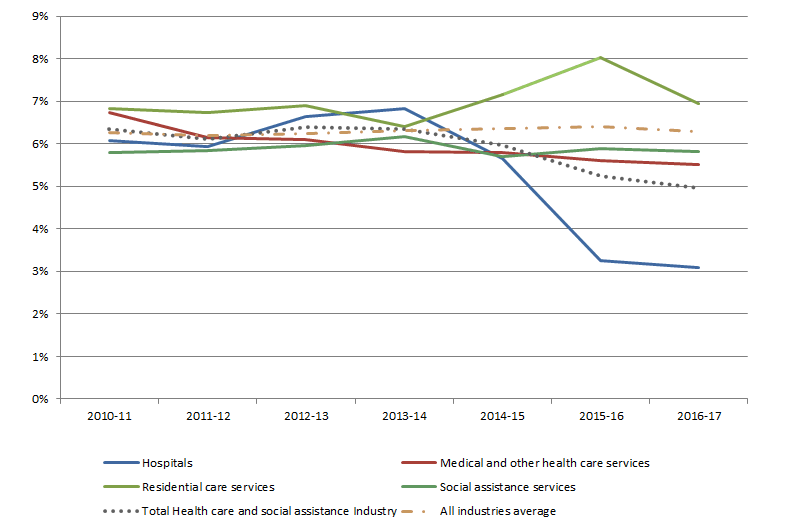
Source: Labour Account Australia, Quarterly Experimental Estimates (cat: 6150.0.55.003)
Job vacancies in the Health care and social assistance industry increased in recent years, with three consecutive annual rises between 2013-14 and 2016-17. This was observed across all four subdivisions.
Graph 3: Job vacancies
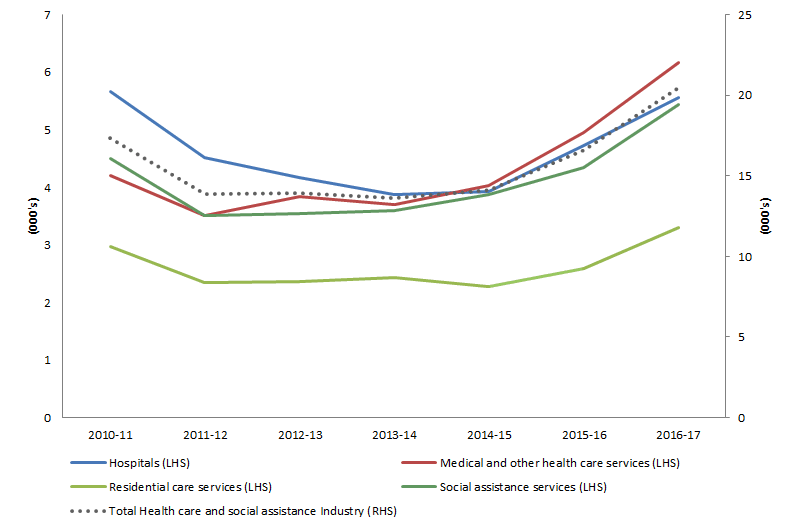
Source: Labour Account Australia, Quarterly Experimental Estimates (cat: 6150.0.55.003)
The average weekly hours worked in Health care and social assistance remained relatively stable between 2010-11 and 2016-17, decreasing slightly from 26.9 hours to 26.6, or 0.3 hours per week. This reduction was less than the change in average weekly hours worked at the economy level, which decreased from 31.7 to 31.0, or 0.7 hours per week.
In 2016-17, the average weekly hours worked was greatest in Hospitals (28.1 hours) and lowest in Residential care services (24.0 hours).
Graph 4: Average weekly hours worked per employed person
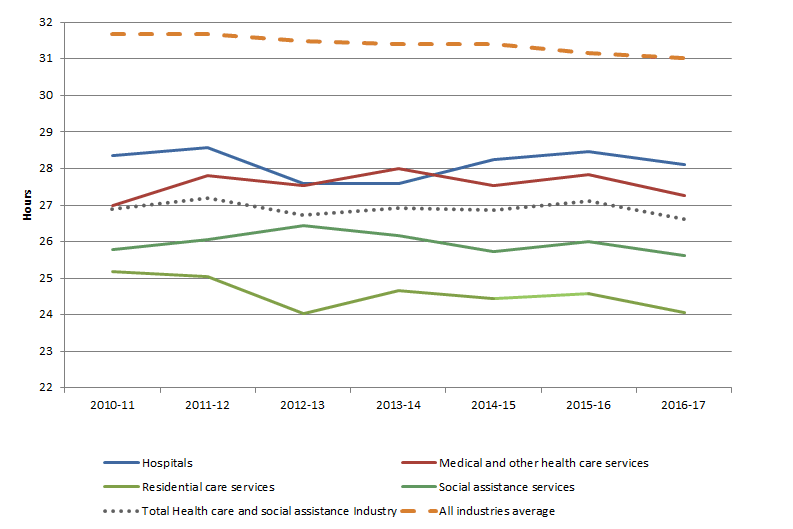
Source: Labour Account Australia, Quarterly Experimental Estimates (cat: 6150.0.55.003)
‘Labour income’ includes compensation of employees and labour income from self-employment. Between 2010-11 and 2016-17, total labour income for the Health care and social assistance industry increased by 35.3 percent, in line with the strong growth in jobs over the period.
Over this same period, the average hourly income per employed person in the Health care and social assistance industry rose by 8.6 per cent, from $44.05 to $47.84. This average figure rose for all subdivisions except for Hospitals, which remained stable.
Over the past seven years, Residential care services has been the highest paying subdivision in the industry, with the figure at $52.68 per hour in 2016-17. In contrast, Hospitals has been the lowest, at $45.05 per hour in 2016-17.
Graph 5: Average hourly income per employed person
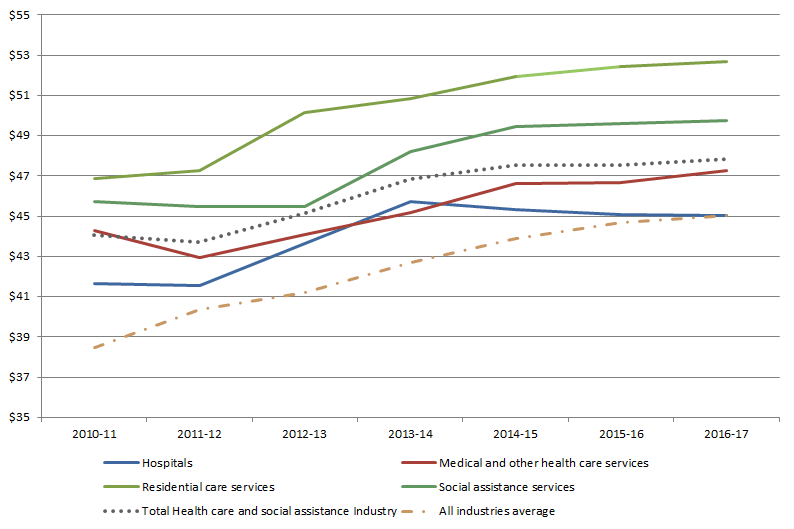
Source: Labour Account Australia, Quarterly Experimental Estimates (cat: 6150.0.55.003)
As this spotlight has shown, the Australian Labour Account provides an overarching picture of the Australian labour market. Through bringing together a range of data, it is possible to produce highly coherent estimates of the number of jobs, people, hours worked and labour income in each industry.
Information on the Health care and social assistance industry can be found in Table 18 (for quarterly information) and Table 39 (for annual information, including information for the four subdivisions).
 Quality Declaration
  Print Page
 Print All