|
|
WESTERN AUSTRALIA
SUMMARY OF FINDINGS
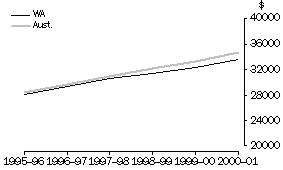
For the financial year 2000-01, the average individual annual wage and salary income for wage and salary earners in Western Australia was $33,620. This was an increase of 4.2% over the previous year ($32,269) and a 19.8% increase on the average in 1995-96 ($28,072). The average annual rate of increase since 1995-96 has been 3.7%.
From 1995-96 to 2000-01 average wage and salary income for employees in Western Australia was above the averages for employees in Queensland, South Australia and Tasmania and slightly below the average for all employees across Australia. In 2000-01, the Western Australian average was around $1,125 less than the Australian average, compared with a difference of around $420 in 1995-96. On average, employees in Western Australia earned almost $6,000 less in 2000-01 than those in the Australian Capital Territory, who have the highest average.
Total wage and salary income paid to the state's wage and salary earners increased from $23.4 billion in 1999-00 to $24.5 billion in 2000-01, an increase of 4.7%. The average annual rate of increase over the last five years has also been 4.7%. For the same period the number of wage and salary earners increased by 0.5% overall, from around 695,440 people in 1995-96 to 729,200 people in 2000-01.
AVERAGE ANNUAL WAGE AND SALARY INCOME,
Western Australia and Australia, 1995-96 to 2000-01
 Source: ATO Income Tax Data.
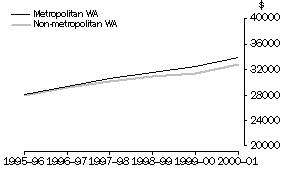
METROPOLITAN AND NON-METROPOLITAN WESTERN AUSTRALIA
In 2000-01, 75.4% of the state's wage and salary earners resided in metropolitan Western Australia (i.e. Perth Statistical Division), up slightly from 74.9% in 1995-96. Metropolitan Western Australia comprised 74.2% of the state's eligible workforce, i.e. persons aged 15 years and over, in 2000-01.
In 1995-96, average wage and salary incomes for employees in metropolitan and non-metropolitan Western Australia were almost the same - $28,086 for metropolitan WA and $27,936 for non-metropolitan WA, a difference of $150 or 0.5%. Since then, however, average earnings have increased more in the metropolitan area with the difference in 2000-01 being $1,141 or 3.5% ($33,872 for metropolitan WA compared with $32,731 for non-metropolitan WA). Since 1995-96 average earnings have increased by almost $5,800 in the metropolitan area compared with an increase of around $4,800 in non-metropolitan areas.
WAGE AND SALARY EARNERS, Metropolitan(a) and non-metropolitan Western Australia, 1995-96 to 2000-01
 | | | | | | | % Change |
| | | | | | |
|
| 1995-96 | 1996-97 | 1997-98 | 1998-99 | 1999-00 | 2000-01 | 1999-00 to 2000-01 | 1995-96 to 2000-01(b) |
|
WAGE AND SALARY EARNERS (no.) |
|
| Metropolitan WA | 521,014 | 528,233 | 541,399 | 546,424 | 546,222 | 549,947 | 0.7 | 1.1 |
| Non-metropolitan WA | 169,411 | 174,126 | 178,141 | 175,239 | 173,133 | 173,394 | 0.2 | 0.5 |
| Total WA(c) | 695,440 | 707,601 | 724,649 | 727,615 | 725,906 | 729,200 | 0.5 | 1.0 |
|
WAGE AND SALARY INCOME ($m) |
|
| Metropolitan WA | 14,633.1 | 15,531.9 | 16,591.9 | 17,269.0 | 17,753.3 | 18,627.9 | 4.9 | 4.9 |
| Non-metropolitan WA | 4,732.6 | 5,077.6 | 5,373.2 | 5,425.2 | 5,444.5 | 5,675.3 | 4.2 | 3.7 |
| Total WA(c) | 19,522.7 | 20,778.7 | 22,134.5 | 22,901.4 | 23,424.6 | 24,515.6 | 4.7 | 4.7 |
|
AVERAGE WAGE AND SALARY INCOME ($) |
|
| Metropolitan WA | 28,086 | 29,403 | 30,646 | 31,604 | 32,502 | 33,872 | 4.2 | 3.8 |
| Non-metropolitan WA | 27,936 | 29,161 | 30,163 | 30,959 | 31,447 | 32,731 | 4.1 | 3.2 |
| Total WA(c) | 28,072 | 29,365 | 30,545 | 31,475 | 32,269 | 33,620 | 4.2 | 3.7 |
| | | | | | | | |
| Metropolitan/non-metropolitan difference(d) (%) | 0.5 | 0.8 | 1.6 | 2.1 | 3.4 | 3.5 | - | - |
|
(a) Metropolitan WA has been defined as comprising the Perth Statistical Division.
(b) Average annual rate of increase.
(c) Total includes data that could not be allocated to either metropolitan or non-metropolitan.
(d) Non-metropolitan WA used as denominator to calculate percentage difference.
Note: Indigenous persons engaged in CDEP projects may be included in the above data for the years 1995-96 to 1997-98 and excluded for 1998-99 onwards. Consequently changes between 1997-98 and 1998-99 and 1995-96 and 2000-01 in particular need to be treated with caution. For further details please refer to the Explanatory Notes.
Source: ATO Income Tax Data.
AVERAGE ANNUAL WAGE AND SALARY INCOME,
Metropolitan and non-metropolitan Western Australia, 1995-96 to 2000-01
 Source: ATO Income Tax Data.
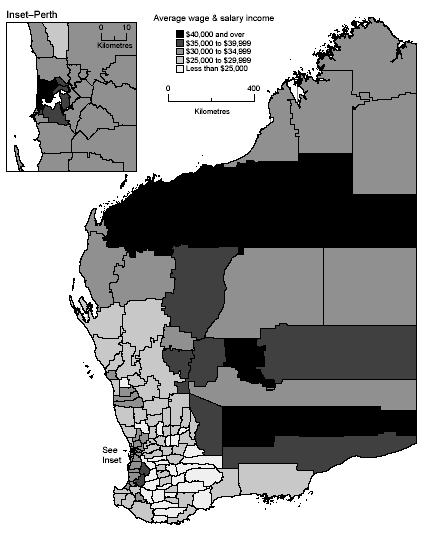
LOCAL GOVERNMENT AREAS
In 2000-01, the local government area with the highest average wage and salary income in Western Australia was Ashburton (S) in the state's north west, with an annual average of $51,781. Mining is the main activity in this LGA and is indicative of the high wages and salaries paid to some people employed in this industry. Iron ore, oil and gas are the main commodities mined in Ashburto-n. Other non-metropolitan LGAs ranked in the top ten are also mining areas including East Pilbara (S) ($47,177), Port Hedland (T) ($44,770) and Coolgardie (S) ($44,883). Commodities mined in these LGAs include gold, copper, nickel, iron ore and salt.
Six of the top ten LGAs with the highest average wage and salary incomes in 2000-01 are located in the inner Perth area, along the coastal suburbs to the north of the Swan River. These include Peppermint Grove, ranked second ($49,609), Cottesloe ($49,594), Nedlands ($48,632), Claremont ($47,943), Subiaco ($45,020) and Mosman Park ($44,546).
Of the 142 local government areas in the state, thirty two had averages above that for the state ($33,620) while twenty seven had averages above the national figure of $34,745. Fourteen LGAs, or 10%, had averages greater than $40,000 per annum.
LGAs WITH HIGHEST AVERAGE ANNUAL WAGE AND SALARY INCOME, Western Australia, 2000-01
| LGA Code | LGA Name | $ |
|
| 50250 | Ashburton (S) | 51,781 |
| 56930 | Peppermint Grove (S) | 49,609 |
| 52170 | Cottesloe (T) | 49,594 |
| 56580 | Nedlands (C) | 48,632 |
| 51750 | Claremont (T) | 47,943 |
|
Source: ATO Income Tax Data.
Wickepin (S), located 210 kilometres south-east of Perth in the state's Wheatbelt region, recorded the lowest wage and salary income in Western Australia and Australia in 2000-01 with an annual average of $19,844. It was the only local government area in Australia with an average below $20,000. The Wheatbelt region and the Great Southern agricultural district contain most of the LGAs in the state with the lowest average wage and salary incomes. These include Broomehill ($20,112), Kent ($21,620), Williams ($22,854), Jerramungup ($23,107) and Kondinin ($23,498). It should be noted that these LGAs are rich agricultural districts and persons in their own business such as farmers and other local business owners are not included in the wage and salary earner data.
LGAs WITH LOWEST AVERAGE ANNUAL WAGE AND SALARY INCOME, Western Australia, 2000-01
| LGA Code | LGA Name | $ |
|
| 59100 | Wickepin (S) | 19,844 |
| 51050 | Broomehill (S) | 20,112 |
| 54480 | Kent (S) | 21,620 |
| 58190 | Tammin (S) | 21,764 |
| 59170 | Williams (S) | 22,854 |
|
Source: ATO Income Tax Data.
AVERAGE ANNUAL WAGE AND SALARY INCOME, LGAs, Western Australia, 2000-01
 Source: ATO Income Tax Data.
WAGE AND SALARY EARNERS, LGAs, Western Australia, 1999-2000 and 2000-01
| | | | 1999-2000 | | | 2000-01 |
| |
|
|
| LGA Code | LGA Name | Wage and salary earners | Wage and salary income | Average wage and salary income | Wage and salary earners | Wage and salary income | Average wage and salary income |
| | no. | $m | $ | no. | $m | $ |
|
| 50080 | Albany (C) | 9,844 | 263.2 | 26,740 | 9,701 | 266.3 | 27,447 |
| 50210 | Armadale (C) | 19,579 | 569.7 | 29,100 | 19,368 | 581.4 | 30,017 |
| 50250 | Ashburton (S) | 2,704 | 131.3 | 48,545 | 2,722 | 140.9 | 51,781 |
| 50280 | Augusta-Margaret River (S) | 3,417 | 85.7 | 25,080 | 3,499 | 90.8 | 25,951 |
| 50350 | Bassendean (T) | 5,324 | 159.2 | 29,899 | 5,328 | 166.2 | 31,200 |
| 50420 | Bayswater (C) | 23,378 | 729.4 | 31,198 | 22,971 | 752.0 | 32,736 |
| 50490 | Belmont (C) | 10,951 | 324.5 | 29,633 | 11,122 | 342.3 | 30,780 |
| 50560 | Beverley (S) | 447 | 11.9 | 26,634 | 409 | 11.2 | 27,495 |
| 50630 | Boddington (S) | 542 | 19.8 | 36,543 | 520 | 20.4 | 39,262 |
| 50770 | Boyup Brook (S) | 450 | 10.9 | 24,263 | 459 | 11.3 | 24,698 |
| 50840 | Bridgetown-Greenbushes (S) | 1,401 | 40.9 | 29,202 | 1,461 | 44.8 | 30,696 |
| 50910 | Brookton (S) | 274 | 6.0 | 21,886 | 257 | 6.3 | 24,577 |
| 50980 | Broome (S) | 4,186 | 133.3 | 31,850 | 4,269 | 139.9 | 32,762 |
| 51050 | Broomehill (S) | 150 | 3.1 | 20,538 | 151 | 3.0 | 20,112 |
| 51120 | Bruce Rock (S) | 329 | 8.0 | 24,239 | 275 | 7.0 | 25,492 |
| 51190 | Bunbury (C) | 8,339 | 264.3 | 31,693 | 8,510 | 273.7 | 32,165 |
| 51260 | Busselton (S) | 7,359 | 191.7 | 26,049 | 7,534 | 203.1 | 26,962 |
| 51310 | Cambridge (T) | 9,540 | 389.7 | 40,853 | 9,353 | 410.9 | 43,933 |
| 51330 | Canning (C) | 31,761 | 995.1 | 31,331 | 31,666 | 1,028.9 | 32,491 |
| 51400 | Capel (S) | 2,219 | 66.9 | 30,140 | 2,205 | 68.9 | 31,252 |
| 51470 | Carnamah (S) | 350 | 10.6 | 30,254 | 337 | 10.4 | 30,969 |
| 51540 | Carnarvon (S) | 2,107 | 61.1 | 28,994 | 2,031 | 61.5 | 30,263 |
| 51610 | Chapman Valley (S) | 291 | 6.3 | 21,557 | 307 | 7.8 | 25,439 |
| 51680 | Chittering (S) | 1,246 | 37.7 | 30,234 | 1,274 | 39.7 | 31,201 |
| 51750 | Claremont (T) | 3,361 | 151.5 | 45,090 | 3,267 | 156.6 | 47,943 |
| 51820 | Cockburn (C) | 26,730 | 830.6 | 31,075 | 27,635 | 885.1 | 32,030 |
| 51890 | Collie (S) | 3,443 | 128.6 | 37,341 | 3,348 | 123.1 | 36,770 |
| 51960 | Coolgardie (S) | 1,757 | 77.2 | 43,962 | 1,830 | 82.1 | 44,883 |
| 52030 | Coorow (S) | 381 | 11.7 | 30,702 | 374 | 12.6 | 33,707 |
| 52100 | Corrigin (S) | 425 | 10.1 | 23,716 | 376 | 9.5 | 25,371 |
| 52170 | Cottesloe (T) | 2,842 | 133.6 | 47,018 | 2,806 | 139.2 | 49,594 |
| 52240 | Cranbrook (S) | 345 | 8.0 | 23,314 | 356 | 8.8 | 24,708 |
| 52310 | Cuballing (S) | 217 | 5.4 | 24,682 | 198 | 5.0 | 25,496 |
| 52380 | Cue (S) | 123 | 4.0 | 32,215 | 94 | 3.1 | 32,740 |
| 52450 | Cunderdin (S) | 470 | 11.5 | 24,506 | 415 | 11.2 | 26,924 |
| 52520 | Dalwallinu (S) | 526 | 13.2 | 25,067 | 502 | 12.6 | 25,199 |
| 52590 | Dandaragan (S) | 795 | 21.1 | 26,594 | 793 | 22.0 | 27,696 |
| 52660 | Dardanup (S) | 4,774 | 154.1 | 32,270 | 4,955 | 160.6 | 32,417 |
| 52730 | Denmark (S) | 1,093 | 25.4 | 23,284 | 1,142 | 27.5 | 24,069 |
| 52800 | Derby-West Kimberley (S) | 1,613 | 51.0 | 31,624 | 1,545 | 51.6 | 33,370 |
| 52870 | Donnybrook-Balingup (S) | 1,565 | 42.9 | 27,402 | 1,588 | 43.9 | 27,626 |
| 52940 | Dowerin (S) | 242 | 5.5 | 22,543 | 219 | 5.2 | 23,732 |
| 53010 | Dumbleyung (S) | 217 | 5.1 | 23,302 | 201 | 4.8 | 23,633 |
| 53080 | Dundas (S) | 466 | 17.0 | 36,559 | 439 | 17.3 | 39,402 |
| 53150 | East Fremantle (T) | 2,807 | 103.8 | 36,976 | 2,737 | 107.0 | 39,111 |
| 53220 | East Pilbara (S) | 2,126 | 100.5 | 47,253 | 2,130 | 100.5 | 47,177 |
| 53290 | Esperance (S) | 4,493 | 121.1 | 26,946 | 4,361 | 123.2 | 28,251 |
| 53360 | Exmouth (S) | 875 | 27.4 | 31,325 | 909 | 29.3 | 32,237 |
| 53430 | Fremantle (C) | 10,209 | 338.8 | 33,186 | 10,195 | 353.6 | 34,680 |
| 53500 | Geraldton (C) | 6,928 | 205.5 | 29,656 | 7,139 | 218.8 | 30,645 |
| 53570 | Gingin (S) | 1,147 | 31.3 | 27,321 | 1,217 | 34.7 | 28,500 |
| 53640 | Gnowangerup (S) | 483 | 11.6 | 23,959 | 443 | 11.2 | 25,304 |
| 53710 | Goomalling (S) | 212 | 5.2 | 24,331 | 200 | 5.0 | 25,213 |
| 53780 | Gosnells (C) | 33,827 | 999.0 | 29,532 | 34,337 | 1,053.3 | 30,674 |
| 53850 | Greenough (S) | 4,291 | 126.9 | 29,581 | 4,448 | 136.2 | 30,631 |
| 53920 | Halls Creek (S) | 454 | 13.3 | 29,310 | 431 | 13.8 | 32,067 |
| 53990 | Harvey (S) | 8,860 | 283.7 | 32,024 | 9,132 | 295.6 | 32,369 |
| 54060 | Irwin (S) | 948 | 27.9 | 29,422 | 962 | 28.1 | 29,179 |
| 54130 | Jerramungup (S) | 417 | 9.3 | 22,199 | 355 | 8.2 | 23,107 |
| 54170 | Joondalup (C) | 70,151 | 2,283.1 | 32,545 | 70,574 | 2,386.9 | 33,821 |
| 54200 | Kalamunda (S) | 20,285 | 631.0 | 31,107 | 20,250 | 657.2 | 32,455 |
| 54280 | Kalgoorlie/Boulder (C) | 14,145 | 539.3 | 38,123 | 14,307 | 573.5 | 40,087 |
| 54340 | Katanning (S) | 1,662 | 42.7 | 25,704 | 1,568 | 42.2 | 26,915 |
| 54410 | Kellerberrin (S) | 401 | 9.5 | 23,577 | 354 | 8.8 | 24,750 |
| 54480 | Kent (S) | 189 | 3.6 | 18,855 | 161 | 3.5 | 21,620 |
| 54550 | Kojonup (S) | 810 | 19.3 | 23,795 | 759 | 18.6 | 24,456 |
| 54620 | Kondinin (S) | 371 | 8.3 | 22,461 | 310 | 7.3 | 23,498 |
| 54690 | Koorda (S) | 161 | 3.9 | 24,486 | 142 | 3.7 | 25,723 |
| 54760 | Kulin (S) | 269 | 5.8 | 21,410 | 220 | 5.5 | 24,802 |
| 54830 | Kwinana (T) | 7,106 | 209.4 | 29,466 | 7,268 | 220.2 | 30,295 |
| 54900 | Lake Grace (S) | 611 | 14.4 | 23,527 | 502 | 12.2 | 24,303 |
| 54970 | Laverton (S) | 171 | 5.7 | 33,120 | 140 | 5.3 | 37,758 |
| 55040 | Leonora (S) | 871 | 38.0 | 43,589 | 752 | 33.3 | 44,329 |
| 55110 | Mandurah (C) | 13,744 | 432.3 | 31,452 | 14,316 | 468.1 | 32,699 |
| 55180 | Manjimup (S) | 3,661 | 95.2 | 25,992 | 3,626 | 96.3 | 26,562 |
| 55250 | Meekatharra (S) | 492 | 16.8 | 34,065 | 458 | 16.4 | 35,887 |
| 55320 | Melville (C) | 37,272 | 1,321.1 | 35,445 | 37,139 | 1,383.2 | 37,243 |
| 55390 | Menzies (S) | 37 | 1.2 | 31,298 | 31 | 1.0 | 33,059 |
| 55460 | Merredin (S) | 1,442 | 40.5 | 28,114 | 1,319 | 38.1 | 28,862 |
| 55530 | Mingenew (S) | 219 | 5.1 | 23,250 | 189 | 4.6 | 24,530 |
| 55600 | Moora (S) | 1,006 | 27.4 | 27,267 | 961 | 27.1 | 28,211 |
| 55670 | Morawa (S) | 321 | 8.5 | 26,600 | 268 | 7.6 | 28,214 |
| 55740 | Mosman Park (T) | 2,887 | 119.9 | 41,542 | 2,805 | 125.0 | 44,546 |
| 55810 | Mount Magnet (S) | 293 | 10.5 | 35,853 | 270 | 10.2 | 37,680 |
| 55880 | Mount Marshall (S) | 209 | 4.9 | 23,427 | 155 | 4.0 | 25,506 |
| 55950 | Mukinbudin (S) | 210 | 4.5 | 21,502 | 216 | 5.4 | 25,081 |
| 56020 | Mullewa (S) | 279 | 6.4 | 23,103 | 243 | 6.7 | 27,579 |
| 56090 | Mundaring (S) | 13,343 | 426.5 | 31,962 | 13,286 | 440.7 | 33,169 |
| 56160 | Murchison (S) | 32 | 0.8 | 24,887 | 28 | 0.8 | 27,465 |
| 56230 | Murray (S) | 3,602 | 112.5 | 31,227 | 3,701 | 121.8 | 32,922 |
| 56300 | Nannup (S) | 396 | 9.8 | 24,711 | 390 | 10.2 | 26,163 |
| 56370 | Narembeen (S) | 308 | 6.7 | 21,789 | 252 | 6.3 | 24,933 |
| 56440 | Narrogin (T) | 1,573 | 43.2 | 27,481 | 1,511 | 42.8 | 28,308 |
| 56510 | Narrogin (S) | 326 | 8.9 | 27,347 | 305 | 8.7 | 28,473 |
| 56580 | Nedlands (C) | 7,569 | 343.6 | 45,401 | 7,326 | 356.3 | 48,632 |
| 56620 | Ngaanyatjarraku (S) | 217 | 6.7 | 30,894 | 200 | 6.6 | 32,841 |
| 56650 | Northam (T) | 1,804 | 52.1 | 28,895 | 1,776 | 53.7 | 30,216 |
| 56720 | Northam (S) | 1,437 | 41.7 | 29,052 | 1,452 | 43.4 | 29,862 |
| 56790 | Northampton (S) | 875 | 21.3 | 24,369 | 868 | 22.2 | 25,563 |
| 56860 | Nungarin (S) | 82 | 1.5 | 18,540 | 57 | 1.4 | 23,747 |
| 56930 | Peppermint Grove (S) | 639 | 30.1 | 47,108 | 631 | 31.3 | 49,609 |
| 57000 | Perenjori (S) | 172 | 4.0 | 23,281 | 147 | 3.8 | 25,887 |
| 57080 | Perth (C) | 2,922 | 105.6 | 36,140 | 3,171 | 124.6 | 39,303 |
| 57140 | Pingelly (S) | 337 | 7.6 | 22,436 | 300 | 7.3 | 24,331 |
| 57210 | Plantagenet (S) | 1,480 | 35.5 | 23,963 | 1,417 | 34.5 | 24,344 |
| 57280 | Port Hedland (T) | 5,615 | 241.8 | 43,071 | 5,809 | 260.1 | 44,770 |
| 57350 | Quairading (S) | 334 | 8.4 | 25,012 | 317 | 8.1 | 25,429 |
| 57420 | Ravensthorpe (S) | 396 | 9.6 | 24,163 | 374 | 10.0 | 26,607 |
| 57490 | Rockingham (C) | 25,690 | 812.5 | 31,628 | 26,476 | 870.4 | 32,873 |
| 57560 | Roebourne (S) | 6,964 | 288.6 | 41,435 | 7,356 | 325.0 | 44,176 |
| 57630 | Sandstone (S) | 22 | 0.8 | 38,371 | 24 | 0.9 | 36,303 |
| 57700 | Serpentine-Jarrahdale (S) | 4,238 | 134.2 | 31,673 | 4,414 | 145.8 | 33,042 |
| 57770 | Shark Bay (S) | 341 | 9.0 | 26,446 | 334 | 9.5 | 28,338 |
| 57840 | South Perth (C) | 15,064 | 554.8 | 36,829 | 15,076 | 585.5 | 38,838 |
| 57910 | Stirling (C) | 68,652 | 2,216.8 | 32,291 | 68,710 | 2,308.3 | 33,595 |
| 57980 | Subiaco (C) | 6,641 | 283.6 | 42,708 | 6,594 | 296.9 | 45,020 |
| 58050 | Swan (C) | 32,346 | 980.7 | 30,319 | 33,225 | 1,041.6 | 31,349 |
| 58120 | Tambellup (S) | 171 | 3.8 | 22,427 | 146 | 3.7 | 25,573 |
| 58190 | Tammin (S) | 100 | 2.0 | 19,621 | 87 | 1.9 | 21,764 |
| 58260 | Three Springs (S) | 269 | 7.2 | 26,885 | 245 | 7.4 | 30,078 |
| 58330 | Toodyay (S) | 901 | 25.3 | 28,071 | 897 | 27.0 | 30,065 |
| 58400 | Trayning (S) | 112 | 2.7 | 24,078 | 99 | 2.7 | 27,288 |
| 58470 | Upper Gascoyne (S) | 113 | 3.4 | 29,682 | 108 | 3.3 | 30,455 |
| 58510 | Victoria Park (T) | 10,994 | 345.1 | 31,389 | 11,101 | 363.8 | 32,769 |
| 58540 | Victoria Plains (S) | 339 | 7.6 | 22,312 | 316 | 7.7 | 24,305 |
| 58570 | Vincent (T) | 10,816 | 385.6 | 35,651 | 10,571 | 398.5 | 37,698 |
| 58610 | Wagin (S) | 620 | 16.1 | 25,924 | 561 | 14.8 | 26,349 |
| 58680 | Wandering (S) | 101 | 2.3 | 22,387 | 91 | 2.2 | 24,380 |
| 58760 | Wanneroo (C) | 29,298 | 844.6 | 28,827 | 30,545 | 915.5 | 29,971 |
| 58820 | Waroona (S) | 1,125 | 36.7 | 32,613 | 1,112 | 38.3 | 34,430 |
| 58890 | West Arthur (S) | 192 | 4.9 | 25,433 | 182 | 4.5 | 24,613 |
| 59030 | Westonia (S) | 73 | 1.7 | 23,315 | 68 | 1.7 | 25,417 |
| 59100 | Wickepin (S) | 225 | 4.3 | 19,186 | 230 | 4.6 | 19,844 |
| 59170 | Williams (S) | 352 | 8.3 | 23,449 | 350 | 8.0 | 22,854 |
| 59250 | Wiluna (S) | 84 | 2.7 | 31,558 | 91 | 3.1 | 34,271 |
| 59310 | Wongan-Ballidu (S) | 632 | 16.3 | 25,714 | 573 | 15.7 | 27,425 |
| 59380 | Woodanilling (S) | 76 | 1.8 | 23,060 | 69 | 1.7 | 24,047 |
| 59450 | Wyalkatchem (S) | 199 | 4.7 | 23,702 | 159 | 4.6 | 28,636 |
| 59520 | Wyndham-East Kimberley (S) | 2,504 | 79.2 | 31,649 | 2,472 | 82.0 | 33,187 |
| 59590 | Yalgoo (S) | 74 | 2.0 | 26,781 | 66 | 1.8 | 26,943 |
| 59660 | Yilgarn (S) | 703 | 24.7 | 35,090 | 629 | 22.8 | 36,226 |
| 59730 | York (S) | 940 | 25.0 | 26,594 | 935 | 27.2 | 29,141 |
| 59999 | LGA unknown | 6,551 | 226.9 | 34,634 | 5,859 | 212.3 | 36,236 |
| Total Western Australia | 725,906 | 23,424.6 | 32,269 | 729,200 | 24,515.6 | 33,620 |
Source: ATO Income Tax Data.
|
 Print Page
 Print All