FEATURE ARTICLE: FOREIGN OWNERSHIP OF EQUITY
INTRODUCTION
This article updates the analysis of foreign ownership of Australian equity presented in the September quarter 2006 issue of Balance of Payments and International Investment Position, Australia (cat. no. 5302.0). The data presented here are sourced from:
- for rest of world holdings of Australian equity, Table 29 of the September quarter 2007 Balance of Payments and International Investment Position, Australia (cat. no. 5302.0) and more detailed data underlying the published aggregates; and
- for total and sectoral aggregates of Australian equity on issue, Tables 40 and 41 of the June quarter 2007 issue of Australian National Accounts: Financial Accounts (cat. no. 5232.0). In calculating equity on issue, the rest of the world component was removed.
A brief explanation of how the financial accounts can be used to derive estimates of foreign ownership of equity in Australian enterprise groups is provided below. For a more detailed explanation, see the article Foreign Ownership of Equity in Australian Enterprise Groups published in the June quarter 1992 issue of
International Investment Position, Australia (cat. no. 5306.0) which is also available on this web site. That article also explains the relationship between these measures and measures derived from earlier foreign participation studies.
The data cover financial instruments classified as equity, which are mainly listed and unlisted shares and units in trusts. Instruments convertible to equity, such as convertible notes, are not treated as equity until converted. Ownership of property by non-residents and ownership of Australian branches of foreign companies are also treated as equity for the purposes of these statistics. The data for amounts on issue for each sub-sector are consolidated by excluding amounts held by related companies in the same sub-sector. Market valuations are used where possible; for the cases where market values are not available, net asset value (total assets less non-equity liabilities and less the paid up value of non-voting shares) has been used as a proxy. A non-resident is defined as any individual, enterprise or other organisation ordinarily domiciled in a country other than Australia. For further definitions of the concepts and methods employed in compiling the source data see the publications Balance of Payments and International Investment Position, Australia: Concepts, Sources and Methods (cat. no. 5331.0) and Australian National Accounts: Financial Accounts (cat. no. 5232.0) which are also available on this web site.
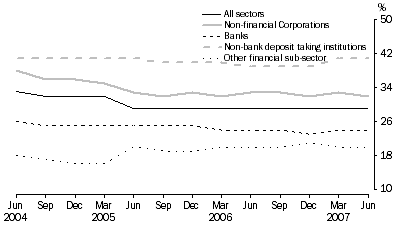
By expressing the value of equity issued by a particular sector and held by the rest of world (non-residents) as a percentage of the total value of all equity issued by that sector, it is possible to derive an estimate of the percentage of foreign ownership in that sector. For example, at 30 June 2007, equity held by 'rest of world' in Australian banks was $76b, or 24% of the total equity of $316b issued by Australian banks. Likewise, an estimate of total foreign ownership of equity in all Australian enterprises can be derived by summing the equity held by non-residents across all sectors and dividing this by the total value of equity issued by all sectors. Estimates of foreign ownership by sector are shown in Table 1.
TABLE 1. OWNERSHIP OF EQUITY IN AUSTRALIAN ENTERPRISE GROUPS(a), Value of Equity Outstanding at End of Period |
|  |
| | | 2003-04 | 2004-05 | Sep Qtr
2005 | Dec Qtr
2005 | Mar Qtr
2006 | Jun Qtr
2006 | Sep Qtr
2006 | Dec Qtr
2006 | Mar Qtr
2007 | Jun Qtr
2007 | |
| |
| All sectors | | | | | | | | | | | |
| Amount issued ($b) | 1 335 | 1 462 | 1 584 | 1 635 | 1 748 | 1 755 | 1 788 | 1 969 | 2 073 | 2 195 | |
| Amount held by rest of world ($b) | 435 | 425 | 454 | 474 | 504 | 507 | 520 | 566 | 606 | 634 | |
| Foreign ownership (%) | 33 | 29 | 29 | 29 | 29 | 29 | 29 | 29 | 29 | 29 | |
| Sectoral Components | | | | | | | | | | | |
| Non-Financial Corporations(b) | | | | | | | | | | | |
| | Amount issued ($b) | 881 | 939 | 1 026 | 1 054 | 1 127 | 1 135 | 1 147 | 1 264 | 1 320 | 1 421 | |
| | Amount held by rest of world ($b) | 333 | 306 | 329 | 344 | 364 | 369 | 376 | 407 | 434 | 459 | |
| | Foreign ownership (%) | 38 | 33 | 32 | 33 | 32 | 33 | 33 | 32 | 33 | 32 | |
| Banks | | | | | | | | | | | |
| | Amount issued ($b) | 189 | 224 | 240 | 249 | 267 | 261 | 269 | 290 | 309 | 316 | |
| | Amount held by rest of world ($b) | 49 | 55 | 59 | 61 | 65 | 62 | 64 | 68 | 75 | 76 | |
| | Foreign ownership (%) | 26 | 25 | 25 | 24 | 24 | 24 | 24 | 23 | 24 | 24 | |
| Non-bank deposit taking institutions | | | | | | | | | | | |
| | Amount issued ($b) | 31 | 33 | 35 | 35 | 35 | 36 | 37 | 39 | 39 | 39 | |
| | Amount held by rest of world ($b) | 13 | 14 | 14 | 14 | 14 | 14 | 14 | 15 | 16 | 16 | |
| | Foreign ownership (%) | 41 | 41 | 40 | 40 | 40 | 39 | 39 | 39 | 41 | 41 | |
| Other financial sub-sectors(c) | | | | | | | | | | | |
| | Amount issued ($b) | 221 | 255 | 273 | 286 | 306 | 310 | 324 | 366 | 394 | 410 | |
| | Amount held by rest of world ($b) | 41 | 50 | 53 | 55 | 61 | 61 | 65 | 77 | 81 | 83 | |
| | Foreign ownership (%) | 18 | 20 | 19 | 19 | 20 | 20 | 20 | 21 | 20 | 20 | |
| Central Bank(d) | | | | | | | | | | | |
| | Amount issued ($b) | 13 | 11 | 10 | 11 | 13 | 13 | 12 | 11 | 11 | 10 | |
| |
| (a) Equity includes units in trusts. |
| (b) Includes private non-financial corporations; and national, state and local public non-financial corporations. |
| (c) Includes life and other insurance corporations; central borrowing authorities; and other financial institutions. |
| (d) There is no foreign ownership in this sub-sector. |
ANALYSIS OF RESULTS
Table 1 shows that the value of equity on issue by Australian enterprise groups at 30 June 2007 stood at $2,195b. Of this total, 65% related to shares or similar equity interests issued by non-financial corporations. Other financial sub-sectors, including life and other insurance corporations and central borrowing authorities accounted for 19%; banks accounted for a further 14% of total equity issued; while lesser amounts were issued by 'non-bank deposit taking institutions' 2%; and the Central Bank 1%.
Of the total equity on issue at 30 June 2007, non-residents held equity valued at $634b (29%), while residents held $1,561b (71%).
The total value of equity on issue increased by 25% from $1,755b to $2,195b from 30 June 2006 to 30 June 2007. The main quarter in which the increase occurred was the December quarter 2006, when the value of equity on issue increased by $181b (10%). This increase was driven by the non-financial corporations which rose $117b (10%), other financial sub-sectors which rose $42b (13%) and banks which rose $21b (8%).
The data in table one demonstrates a steady increase in the value of equity on issue in Australia, which is consistent with the reported performance of the Australian stock market. The more modest rise in the value of Australian equity on issue during the June quarter 2005 resulted from significant corporate restructures which impacted on the total level of Australian equity on issue, and the amount of Australian equity held by non-residents.
FOREIGN OWNERSHIP OF AUSTRALIAN ENTERPRISE GROUP BY SECTOR
COUNTRY ANALYSIS
As shown in Table 2 below, the value of holdings of equity in Australian enterprise groups by non-residents can also be further disaggregated according to the country of residence of the immediate holder. This disaggregation has been done as at the end of each financial year.
TABLE 2. OWNERSHIP OF EQUITY IN AUSTRALIAN ENTERPRISE GROUPS(a), by Non-residents |
| |
| | | 30 June 2005 | 30 June 2006 | 30 June 2007 | |
| Geographical location of immediate investor by Sector/Country/Country groups | $b | (%) | $b | (%) | $b | (%) | |
| |
| All sectors | 425 | 100 | 507 | 100 | 634 | 100 | |
| United Kingdom | 117 | 28 | 146 | 29 | 183 | 29 | |
| United States of America | 136 | 32 | 167 | 33 | 212 | 33 | |
| Japan | 21 | 5 | 24 | 5 | 27 | 4 | |
| Other countries(b) | 150 | 35 | 170 | 34 | 213 | 34 | |
| OECD | 351 | 83 | 421 | 83 | 524 | 83 | |
| APEC | 195 | 46 | 232 | 46 | 290 | 46 | |
| EU | 162 | 38 | 196 | 39 | 242 | 38 | |
| ASEAN | 11 | 3 | 13 | 3 | 16 | 3 | |
| Sectoral components(c) | | | | | | | |
| Non-financial corporations(d) | 306 | 100 | 369 | 100 | 459 | 100 | |
| | United Kingdom | 83 | 27 | 106 | 29 | 131 | 29 | |
| | United States of America | 94 | 31 | 116 | 31 | 146 | 32 | |
| | Japan | 18 | 6 | 21 | 6 | 24 | 5 | |
| | Other countries(b) | 111 | 36 | 127 | 34 | 158 | 34 | |
| Banks | 55 | 100 | 62 | 100 | 76 | 100 | |
| | United Kingdom | 26 | 47 | 30 | 47 | 36 | 48 | |
| | United States of America | 17 | 32 | 19 | 31 | 22 | 29 | |
| | Japan | 1 | 1 | 1 | 1 | 1 | 1 | |
| | Other countries(b) | 11 | 20 | 13 | 21 | 16 | 21 | |
| Non-bank deposit taking institutions | 14 | 100 | 14 | 100 | 16 | 100 | |
| | United Kingdom | - | 2 | - | 3 | 1 | 8 | |
| | United States of America | 9 | 68 | 10 | 71 | 10 | 66 | |
| | Japan | 1 | 7 | 1 | 6 | 1 | 6 | |
| | Other countries(b) | 3 | 23 | 3 | 20 | 3 | 20 | |
| Other financial sub-sectors(e) | 50 | 100 | 61 | 100 | 83 | 100 | |
| | United Kingdom | 9 | 17 | 11 | 17 | 14 | 17 | |
| | United States of America | 16 | 32 | 22 | 36 | 33 | 40 | |
| | Japan | 1 | 2 | 1 | 1 | 3 | 3 | |
| | Other countries(b) | 25 | 49 | 28 | 46 | 34 | 41 | |
| |
| - nil or rounded to zero (including null cells) |
| (a) Total equity held by non-residents, includes direct and portfolio equity investment. |
| (b) Includes unspecified and all other countries. |
| (c) Data for Reserve Bank are not shown, as there is no foreign ownership in this sub-sector. |
| (d) Includes private non-financial corporations; and national, state and local public non-financial corporations. |
| (e) Includes life and other insurance corporations; central borrowing authorities; and other financial institutions. |
The residents of the United States of America (USA), United Kingdom (UK) and Japan hold the largest proportions of foreign-owned Australian equity on issue. At 30 June 2007, USA residents owned $212b (33%) of the foreign-owned equity in Australian enterprise groups, accounting for 10% of total equity on issue. At the same time, UK residents owned $183b (29%) of the foreign equity holdings in Australian enterprise groups, while residents of Japan owned a further $27b (4%). The UK and Japanese holdings accounted for 8% and 1%, respectively, of total equity on issue.
The proportion of ownership of total non-resident equity in Australia held by residents of each of these countries varies significantly by sector. For example, at 30 June 2007, residents of the UK owned 48% of the total non-resident equity investment in Australian banks, and held 8% in non-bank deposit taking institutions. Residents of the USA dominate the foreign ownership of equity in non-bank deposit taking institutions (66%), but hold less equity in banks than UK residents (29%). While residents of Japan owned 6% of the total non-resident equity investment in non-bank deposit taking institutions at 30 June 2007, their participation rates in the banks and other financial sub-sectors were relatively small.
Residents of APEC economies accounted for $290b (46%) of foreign-owned equity in Australian enterprise groups at 30 June 2007, while residents of EU countries accounted for $242b (38%). The holdings of residents of APEC and EU countries accounted for 13% and 11% respectively of the total equity on issue. The holdings of residents of OECD member countries amounted to $524b, which accounted for 83% of total foreign-owned equity and 24% of total equity on issue.
TABLE 3. FOREIGN EQUITY HOLDINGS, BY DEGREE OF FOREIGN INFLUENCE AND TYPE OF EQUITY - AT 30 JUNE 2007 |
|
| | DIRECT INVESTMENT ENTERPRISE GROUPS | OTHER ENTERPRISE GROUPS | ALL ENTERPRISE GROUPS |
| | 10-50 percent owned by
direct foreign investors | Over 50% owned by
direct foreign investors | | |
| Equity held by rest of world | Direct | Portfolio | Total | Direct | Portfolio | Total | Total | Direct | Portfolio | Total |
$ BILLION |
|
| All sectors | 28 | 3 | 31 | 249 | - | 249 | 354 | 277 | 357 | 634 |
| Sectoral components | | | | | | | | | | |
| Non-financial corporations | 21 | 2 | 23 | 212 | - | 212 | 224 | 233 | 226 | 459 |
| Banks | - | - | - | 7 | - | 7 | 69 | 7 | 69 | 76 |
| Non-bank deposit taking institutions | - | - | - | 16 | - | 16 | - | 16 | - | 16 |
| Other financial sub-sectors | 7 | 1 | 8 | 15 | - | 15 | 61 | 22 | 62 | 83 |
PERCENTAGE |
|
| All sectors | | | | | | | | | | |
| Proportion of total equity on issue | 1 | - | 1 | 11 | - | 11 | 16 | 13 | 16 | 29 |
| Proportion of total equity held by rest of world | 4 | - | 5 | 39 | - | 39 | 56 | 44 | 56 | 100 |
|
| - nil or rounded to zero (including null cells) |
SIGNIFICANT FOREIGN INFLUENCE
Direct investment is defined as capital invested in an enterprise by an investor who exerts a significant influence, either actually or potentially, over the key policies of the enterprise (called a direct investment enterprise). Ownership of 10% or more of the voting shares (or an equivalent equity interest) is regarded as indicative of significant influence by an investor.
Three enterprise group dissections are shown in Table 3 and these can be associated with three different levels of foreign influence:
Foreign control - direct investment enterprise groups over 50% owned by a direct foreign investor. The level of ownership is sufficient to allow foreign control.
Significant influence - direct investment enterprise groups 10% to 50% owned by their direct foreign investors. The level of ownership allows the potential for significant foreign influence but is not necessarily sufficient to allow foreign control.
Other influence - other enterprise groups with foreign ownership. The level of ownership is below the threshold used in defining significant foreign influence, as no single foreign investor holds 10% or more of the equity. This equity ownership is classified as portfolio investment.
Analysis of data on equity issued to non-residents by direct investment enterprise groups in Australia, as a proportion of total equity on issue, provides an indication of the amount of influence non-residents have as a result of their equity holdings.
As shown in Table 3, at 30 June 2007, $277b (44%) of the total foreign equity holdings of $634b was in the form of direct investment, with the remaining $357b being in the form of portfolio investment. Of the total equity on issue, these amounts represent 13% for direct investment and 16% for portfolio investment. These proportions vary significantly across sectors.
Of the $277b direct investment, $249b (90%) was in enterprise groups where a direct foreign investor held more than 50% of the shares. The direct investment equity associated with majority direct foreign ownership accounted for 39% of all foreign equity and 11% of all equity issued in Australia.
COUNTRY GROUPS
APEC
Includes Brunei Darussalam, Canada, Chile, People's Republic of China, Hong Kong (SAR of China), Indonesia, Japan, Republic of Korea, Malaysia, Mexico, New Zealand, Papua New Guinea, Peru, Philippines, Russian Federation, Singapore, Chinese Taipei, Thailand, United States of America and Viet Nam.
ASEAN
Includes Brunei Darussalam, Burma (Myanmar), Cambodia, Indonesia, Laos, Malaysia, Philippines, Singapore, Thailand and Viet Nam.
EU
Includes Austria, Belgium, Cyprus, Czech Republic, Denmark, Estonia, Finland, France, Germany, Greece, Hungary, Republic of Ireland, Italy, Latvia, Lithuania, Luxembourg, Malta, Netherlands, Poland, Portugal, Slovak Republic, Slovenia, Spain, Sweden and United Kingdom. Cyprus, Czech Republic, Estonia, Hungary, Latvia, Lithuania, Malta, Poland, Slovak Republic and Slovenia are included from July 2004. Bulgaria and Romania are included from January 2007.
OECD
Includes Austria, Belgium, Canada, Czech Republic, Denmark, Finland, France, Germany, Greece, Hungary, Iceland, Republic of Ireland, Italy, Japan, Republic of Korea, Luxembourg, Mexico, Netherlands, New Zealand, Norway, Poland, Portugal, Slovak Republic, Spain, Sweden, Switzerland, Turkey, United Kingdom and United States of America. Slovak Republic is included from 2000.
FOR MORE INFORMATION
The data used in this analysis are available from the International Investment Section of the Australian Bureau of Statistics. For more information on the availability of related statistics, contact Athol Maritz on Canberra 02 6252 7107 or email athol.maritz@abs.gov.au.
 Print Page
 Print All